You may notice gaps in your metrics data due to outages, platform maintenance, or cluster maintenance such as a resize or restore. You can check DigitalOcean’s status page for outages, review the cluster maintenance window on the Settings tab, or visit the cluster’s Logs tab to look for maintenance events.
How to Monitor Weaviate Cluster Performancepublic
Last verified 1 Jul 2026
DigitalOcean Managed Weaviate is a fully managed Weaviate vector database for retrieval-augmented generation, semantic search, and similarity-based AI workloads. Clusters are provisioned, secured, backed up, and patched by DigitalOcean.
Managed Weaviate clusters expose performance metrics and cluster logs in the Control Panel so you can monitor health, capacity, and operational events.
View Performance Metrics
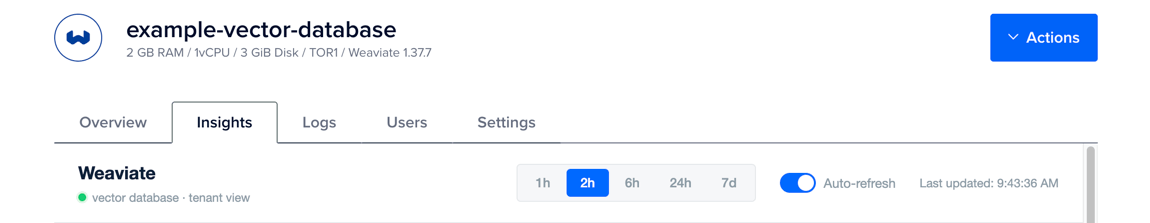
To view performance metrics, go to the Vector Databases page and select the cluster whose metrics you want to view. Click the Insights tab.
Use the time range buttons (1h, 2h, 6h, 24h, or 7d) to change the period shown in the graphs below. Turn on Auto-refresh to update the metrics automatically. The Last updated timestamp shows when the page last refreshed.
At the top of the Insights page, summary cards show current values for Total Shards, Collections, Active Compactions, Read Throughput, and Write Throughput.
The graphs below the summary cards let you track ingestion and query performance, spot latency spikes, and correlate changes with application behavior or resize operations. The following metrics graphs are available:
-
Object Operations
- Object Count
- Ingestion Throughput
- Average Batch Size
- Query Latency
-
Collections
- Collection Count per Node
-
Read / Write Latency
- Read Latency
- Write Latency
-
LSM Engine
- Read / Write Throughput
- Failure Counts
- In-Progress Operations
- Segments
If you recently provisioned the cluster or changed its configuration, it may take a few minutes for metrics data to finish processing before it appears on the Insights tab.
View Cluster Logs
You can view logs to see recent cluster events, including provisioning, configuration changes, maintenance, and error conditions. Use logs alongside Insights metrics when you troubleshoot connectivity issues, failed queries, or unexpected latency.
To view cluster logs, go to the Vector Databases page and select the cluster whose logs you want to view. Click the Logs tab.
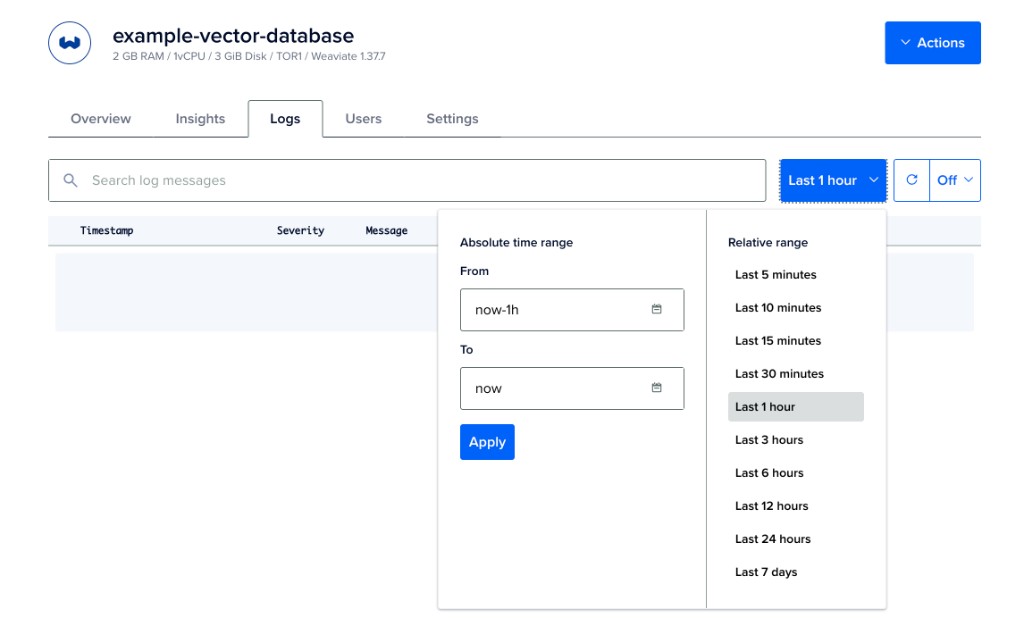
At the top of the Logs tab, use the controls to filter and refresh log entries:
- The time range menu sets how far back to load logs. Choose a relative range such as Last 5 minutes, Last 1 hour, Last 24 hours, or Last 7 days, or use the Absolute time range to set custom From and To values, and then click Apply.
- Click the refresh button to reload logs manually.
- The auto-refresh menu controls automatic updates. To poll for new entries, choose 15sec, 30sec, or 60sec.