You may notice gaps in your metrics data due to outages, platform maintenance, or a database failover or migration. You can check DigitalOcean’s status page for outages, review the cluster maintenance window, or visit the cluster’s Logs (or Logs & Queries) page to look for failovers and migrations.
How to Monitor PostgreSQL Database Performance
Last verified 15 Jul 2026
PostgreSQL is an open source, object-relational database built for extensibility, data integrity, and speed. Its concurrency support makes it fully ACID-compliant, and it supports dynamic loading and catalog-driven operations to let users customize its data types, functions, and more.
DigitalOcean Managed Databases include metrics visualizations so you can monitor performance and health of your database cluster.
-
Cluster metrics monitor the performance of the nodes in a database cluster. Cluster metrics cover primary and standby nodes; metrics for each read-only node are displayed independently. This data can help guide capacity planning and optimization. You can also set up alerting on cluster metrics.
-
Database metrics monitor the performance of the database itself. This data can help assess the health of the database, pinpoint performance bottlenecks, and identify unusual use patterns that may indicate an application bug or security breach.
View Performance Metrics
To view performance metrics, go to the Databases page and select the cluster whose metrics you want to view. On the cluster’s Overview page, click the Insights tab.
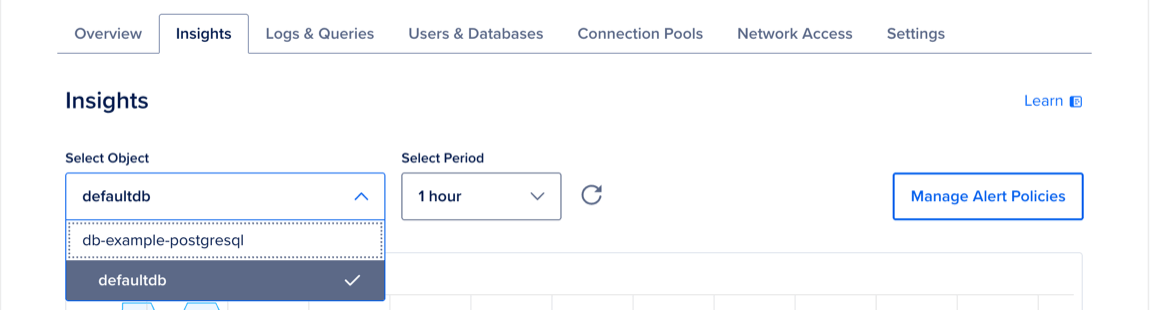
In the Select Object dropdown menu, choose the cluster to view cluster metrics, or choose a database to view database-specific metrics.
In the Select Period dropdown menu, you can choose a time frame for the x-axis of the graphs, ranging from 1 hour to 14 days. Each line in the graphs displays about 300 data points.
If you recently provisioned the cluster or changed its configuration, it may take a few minutes for the metrics data to finish processing before you see it on the Insights page.
If you have 200 or more databases on a single cluster, you may be unable to retrieve their metrics. If you reach this limit, create additional databases in a new cluster.
Cluster Metrics Details
Database clusters have the following cluster metrics:
- CPU usage
- 1-, 5-, and 15-minute load average
- Memory usage
- Disk usage
All resource usage graphs have three lines for minimum, maximum, and average. If you have a one-node cluster, all three lines are a single, superimposed line.
CPU Usage
The CPU usage graph shows, for all nodes in the cluster, the minimum, maximum, and average percentage of processing power being used across all cores.
If you experience a significant increase in CPU usage, check the PostgreSQL throughput graph and query statistics to look for unexpected usage patterns or long-running queries.
Learn more in the Droplet CPU metrics definitions.
Load Average
The load average graph displays 1-, 5-, and 15-minute load averages, averaged across all nodes in the cluster. Load average measures the processes that are either being handled by the processor or are waiting for processor time.
The three time-based load average metrics are calculated as an exponentially weighted moving average over the past 1, 5, and 15 minutes. This metric does not adjust for multiple cores. Learn more in the Droplet load average metrics definitions.
Memory Usage
The memory usage graph presents the minimum, maximum, and average percentage of memory consumption across all nodes in the cluster. Because cached memory can be released on demand, it is not considered in use.
Learn more in the Droplet memory usage metrics definitions.
Disk Usage
The disk usage graph shows the minimum, maximum, and average percentage of disk consumed across all nodes in the cluster. Disk usage is expected to fluctuate during vacuuming, particularly with write-heavy use cases, but you should maintain disk usage below 90%.
Learn more in the Droplet disk I/O metrics definitions.
Replication Status
If you have a standby node configured, the replication status graph records the replication lag between the primary node and standby node or nodes, measured in bytes.
Significant replication lag can indicate network connectivity issues or insufficient CPU resources.
PostgreSQL Database Metrics
PostgreSQL databases expose the following additional metrics:
- Connections
- Cache Hit Ratio
- Index vs Sequential Scans
- Throughput
- Deadlocks
Due to limitations with the Postgres metrics agent, some graphs may not display data in scenarios where the expected metric value is 0. For example, this can occur if you have not run any queries, do not have any active queries running, or have not yet added any tables to a new database.
Connections
The connections graph displays the number of client connections to the database.
You can use a connection pooling utility to reduce connection contention. See How to Manage Connection Pools.
Cache Hit Ratio
The cache hit ratio graph tracks read efficiency by measuring the proportion of reads served from cache compared to the total reads from both cache and disk. Except in data warehouse use cases, an ideal cache hit ratio is 99% or higher, meaning that at least 99% of reads are served from cache and no more than 1% are served from disk.
If your cache hit ratio is consistently below 99%, consider upgrading to a plan with additional memory to increase cache size.
Index vs Sequential Scans
The index vs sequential scans graph displays the percentage of index scans as a proportion of all scans, both index and sequential, across all user tables in the database. Indexes act as pointers to table data and generally make data retrieval more efficient than row-based sequential scans. For read-heavy workloads that use large tables, the proportion of index scans should ideally remain near 99%.
If you use large tables and the proportion of index scans is consistently well below 99%, ensure that appropriate indexes exist on those tables.
Throughput
The throughput graph records the rate of row reads, fetches, inserts, updates, and deletes across all user tables in the database. Monitoring overall usage patterns can help you make tuning decisions and identify potential issues. For example, unexpected changes in throughput patterns may indicate a newly introduced bug or a security issue.
This data can also help you evaluate how efficiently your database handles different types of operations and identify opportunities to improve performance through tuning, schema changes, or scaling. For example, while indexes can improve performance in read-heavy workloads, they can also increase the overhead of insert, update, and delete (DML) operations.
Deadlocks
The deadlocks graph shows the rate of deadlock creation in the database. Deadlocks occur when two or more transactions hold conflicting locks on the same database object at the same time. When PostgreSQL detects a deadlock, it aborts at least one of the affected transactions.
To identify the transactions involved in a deadlock, review the deadlock error details in your PostgreSQL logs. Look for log entries containing messages such as process 12345 detected deadlock. You can also correlate the PostgreSQL error timestamp with your application logs to better understand the conditions that triggered the deadlock.
You can help prevent deadlocks by ensuring that all applications interacting with the database acquire locks on multiple objects in a consistent order.
Access the Metrics Endpoint
You can also view your database cluster’s metrics programmatically via the metrics endpoint. This endpoint includes over twenty times the metrics you can access in the Insights tab in the control panel.
You can access the metrics endpoint with a cURL command or a monitoring system like Prometheus.
Get Hostname and Credentials
First, you need to retrieve your cluster’s metrics hostname by sending a GET request to https://api.digitalocean.com/v2/databases/${UUID}. In the following example, the target database cluster has a standby node, which requires a second host/port pair:
curl --silent -XGET --location 'https://api.digitalocean.com/v2/databases/${UUID}' --header 'Content-Type: application/json' --header "Authorization: Bearer $RO_DIGITALOCEAN_TOKEN" | jq '.database.metrics_endpoints'Which returns the following host/port pairs:
[
  {
    "host": "db-test-for-metrics.c.db.ondigitalocean.com",
    "port": 9273
  },
  {
    "host": "replica-db-test-for-metrics.c.db.ondigitalocean.com",
    "port": 9273
  }
]
Next, you need your cluster’s metrics credentials. You can retrieve these by making a GET request to https://api.digitalocean.com/v2/databases/metrics/credentials with an admin or write token:
curl --silent -XGET --location 'https://api.digitalocean.com/v2/databases/metrics/credentials' --header 'Content-Type: application/json' --header "Authorization: Bearer $RW_DIGITALOCEAN_TOKEN" | jq '.'Which returns the following credentials:
{
  "credentials": {
    "basic_auth_username": "..."
    "basic_auth_password": "...",
  }
}
Access with cURL
To access the endpoint using cURL, make a GET request to https://$HOST:9273/metrics, replacing the hostname, username, and password variables with the credentials you found in the previous steps:
curl -XGET -k -u $USERNAME:$PASSWORD https://$HOST:9273/metricsAccess with Prometheus
To access the endpoint using Prometheus, first copy the following configuration into a file prometheus.yml, replacing the hostname, username, password, and path to CA cert. This configures Prometheus to use all the credentials necessary to access the endpoint:
# prometheus.yml
global:
  scrape_interval: 15s
  evaluation_interval: 15s

scrape_configs:
  - job_name: 'dbaas_cluster_metrics_svc_discovery'
    scheme: https
    tls_config:
      ca_file: /path/to/ca.crt
    dns_sd_configs:
    - names:
      - $TARGET_ADDRESS
      type: 'A'
      port: 9273
      refresh_interval: 15s
    metrics_path: '/metrics'
    basic_auth:
      username: $BASIC_AUTH_USERNAME
      password: $BASIC_AUTH_PASSWORD
Then, copy the following connection script into a file named up.sh. This script runs envsubst and starts a Prometheus container with the config from the previous step:
#!/bin/bash
envsubst < prometheus.yml > /tmp/dbaas-prometheus.yml
docker run -p 9090:9090 \
-v /tmp/dbaas-prometheus.yml:/etc/prometheus/prometheus.yml \
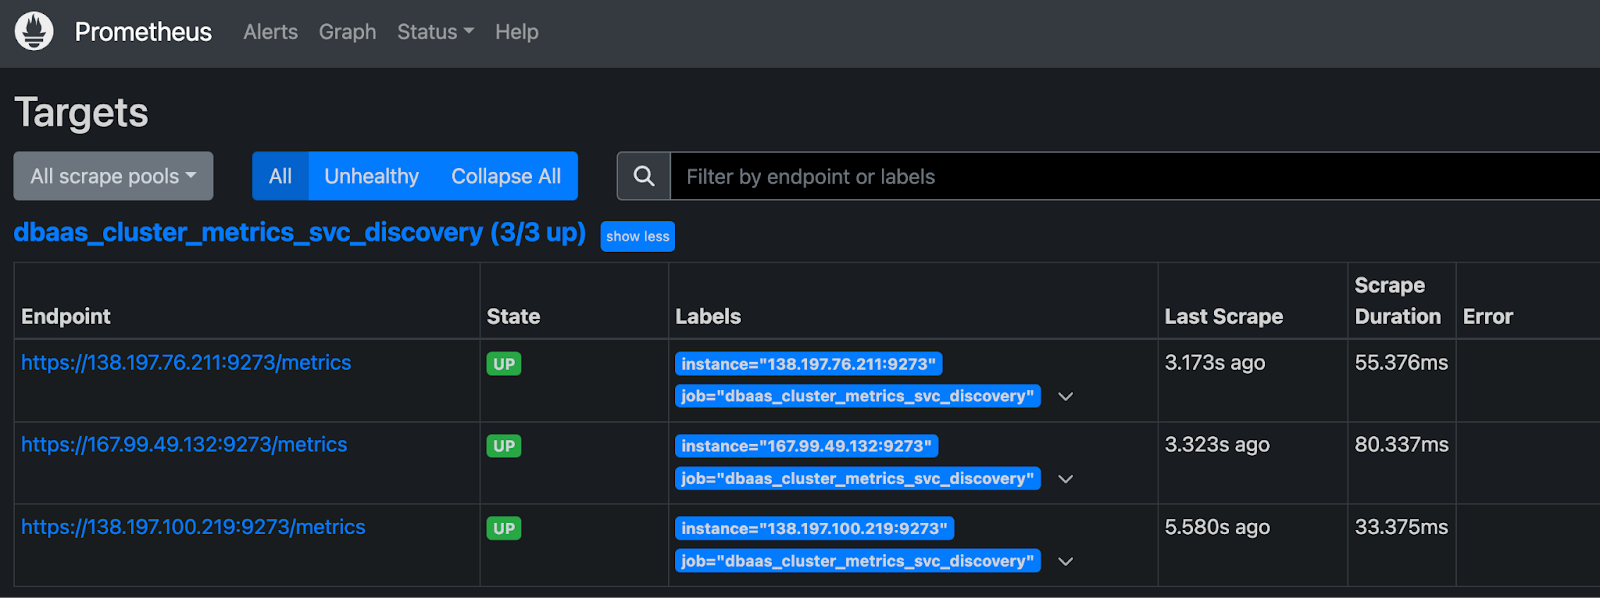
prom/prometheusGo to http://localhost:9090/targets in a browser to confirm that multiple hosts are up and healthy.
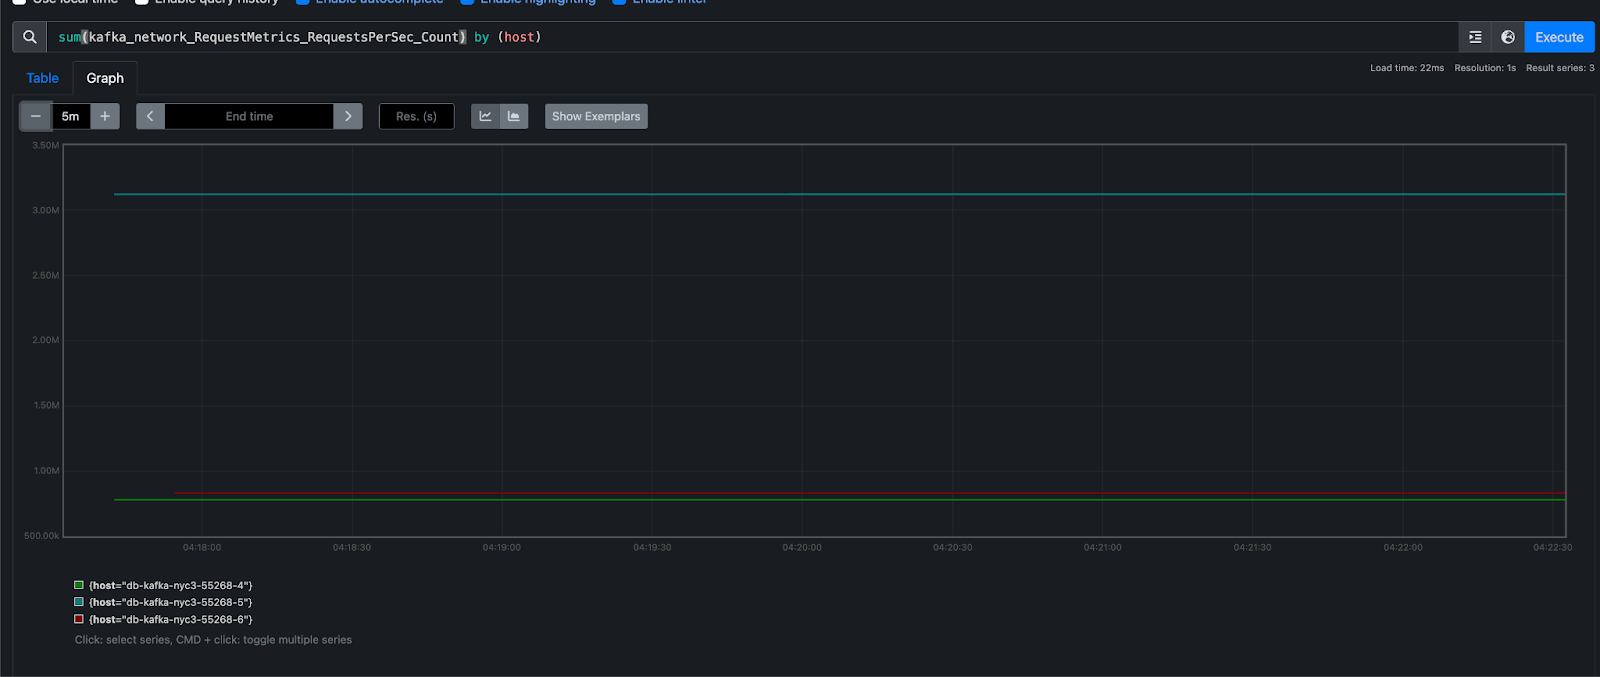
Then, navigate to http://localhost:9090/graph to query Prometheus for metrics.
For more details, see the Prometheus DNS SD docs and TLS config docs.
Allow Metrics Scraping in Trusted Sources
The metrics endpoint on port 9273 uses the same cluster firewall as database connections. Before a collector on another host can scrape metrics, you must add that host to the cluster’s trusted sources.
Add the public IP address of the server running your metrics collector. If the collector runs on a DigitalOcean Droplet, you can add the Droplet by name or tag instead of its IP address.
To add a trusted source in the Control Panel, open your cluster’s Network Access tab and click Add Trusted Sources. For full procedures, see How to Secure PostgreSQL Managed Database Clusters. To manage trusted sources with automation, see doctl databases firewalls.
Stream Metrics with Grafana Alloy and Grafana Mimir
You can scrape the metrics endpoint and forward time-series data to Grafana Mimir or another Prometheus-compatible remote write backend using Grafana Alloy, the OpenTelemetry Collector distribution from Grafana Labs.
Before you configure Alloy, retrieve your cluster’s metrics hostname and credentials as described in Access the Metrics Endpoint, add your collector host to trusted sources, and confirm your Mimir instance accepts remote write requests.
Configure Alloy to Scrape and Remote Write
Copy the following configuration into a file named config.alloy, replacing the placeholder values with your metrics hostname, credentials, and Mimir push URL:
// Forward scraped metrics to Mimir.
prometheus.remote_write "mimir_instance" {
  endpoint {
    url = "http://<your-mimir-host>:9009/api/v1/push"
    // Add Mimir authentication here if required.
  }
}

// Scrape the PostgreSQL metrics endpoint.
prometheus.scrape "do_postgres_metrics" {
  targets = [
    {
      "__address__" = "<your-metrics-hostname>:9273",
      "instance"    = "<your-cluster-name>",
    },
  ]

  scheme       = "https"
  metrics_path = "/metrics"

  basic_auth {
    username = "<your-metrics-username>"
    password = "<your-metrics-password>"
  }

  tls_config {
    insecure_skip_verify = true
  }

  forward_to = [prometheus.remote_write.mimir_instance.receiver]
}The metrics endpoint may present a certificate that public certificate authorities do not recognize. Setting insecure_skip_verify = true allows Alloy to connect in that case. When you have the CA certificate, prefer ca_file as described in Access with Prometheus. Download the certificate as described in Download the CA Certificate, or retrieve it with doctl databases get-ca.
Start Alloy with this configuration file. For installation and startup steps, see the Grafana Alloy documentation. For Mimir remote write configuration, see the Grafana Mimir documentation.
Grafana Agent (Flow Mode, Deprecated)
Grafana Agent Flow mode is deprecated and reached end-of-life in November 2025. Use Grafana Alloy as the supported successor. Alloy uses the same River component syntax, so existing config.river files that define prometheus.scrape and prometheus.remote_write blocks work in Alloy with minimal changes. To migrate, see Grafana’s Agent Flow to Alloy migration guide.
If you still run Grafana Agent during a transition period, use the same prometheus.remote_write and prometheus.scrape blocks from Configure Alloy to Scrape and Remote Write in a config.river file.
Diagnose Connection Issues on Port 9273
If your collector cannot reach the metrics endpoint, run the following command from the host where the collector runs. Replace the placeholder values with your metrics hostname and credentials from Access the Metrics Endpoint:
curl -v -k -u "<your-metrics-username>:<your-metrics-password>" \
  https://<your-metrics-hostname>:9273/metrics
Interpret the result as follows:
- 403 Forbidden: The collector host’s IP address is not in the cluster’s trusted sources. Add the host and retry.
- Connection timeout: A local firewall, network path, or missing trusted source is blocking port 9273. Verify trusted sources and that outbound connections to port 9273 are permitted from the collector host.
- Raw Prometheus metrics text: The endpoint is reachable. If your collector still fails, verify its TLS settings and basic authentication configuration in your Alloy configuration.
Additional Resources
For more details about available metrics, see the PostgreSQL documentation.
To monitor with Percona Monitoring and Management (PMM), see Configure a PMM Monitoring User.