How to View Insights in App Platform
Last verified 24 Apr 2026
App Platform is a fully managed Platform-as-a-Service (PaaS) that deploys applications from Git repositories or container images. It automatically builds, deploys, and scales components while handling all underlying infrastructure.
DigitalOcean App Platform includes metrics visualizations so you can monitor your app’s performance and health.
View Insights Using the Control Panel
Your app’s Insights tab displays metrics about your app’s resource usage, including the following:
- CPU usage. This tracks the percentage of CPU power your app is using.
- Memory usage. This tracks the percentage of memory your app is using in the container. This metrics may differ slightly from the memory usage reported by the operating system as App Platform always allots slightly more memory to your app. App redeployments and DigitalOcean maintenance operations do not contribute to this metric.
- Restart count. This tracks the number of times your app has been restarted. Restarts often indicate that your application has crashed or exited.
- Request rate. For service components, this tracks the number of HTTP requests per second the service is handling.
- P95 request duration. For service components, this tracks the 95th percentile request latency in milliseconds.
- CDN ingress bandwidth. This tracks the bandwidth transmitted by our edge CDN network on behalf of your app. This includes both cache requests served by the CDN and non-cached requests forwarded to your application instance.
- CDN ingress average latency by status code. This tracks the average latency of requests to your app from the CDN, by status code.
- CDN ingress throughput (requests) by status code. This tracks the number of requests to your app from the CDN, by status code.
To view your app’s insights from the control panel, click your app and then click the Insights tab. From here, you can click a resource to filter insights by resource.
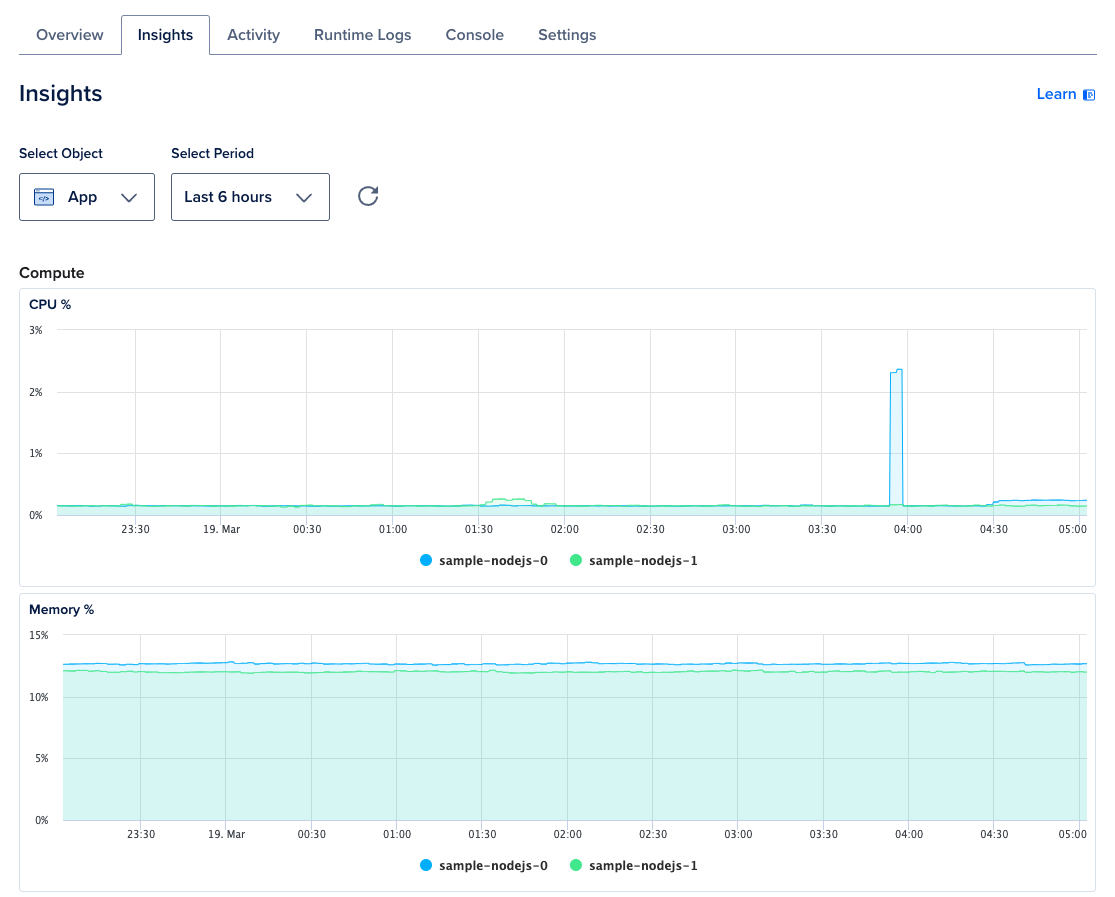
Use the Select Object drop-down to select insights for specific components in your app. Use the Select Period drop-down to select the time interval for which insights are being displayed.
Additionally, you can create alerts for your app and its resources.
View Insights Using the API
You can view the following metrics using the DigitalOcean API: