How to View Metrics For Gradient Notebooks
Last verified 22 Jan 2026
Notebooks are a web-based Jupyter IDE with shared persistent storage for long-term development and inter-notebook collaboration, backed by accelerated compute.
Gradient can record Gradient Notebooks metrics that are available either in real time or after the workload is complete. You can view your Gradient Notebook metrics in the Paperspace console or using the Paperspace CLI.
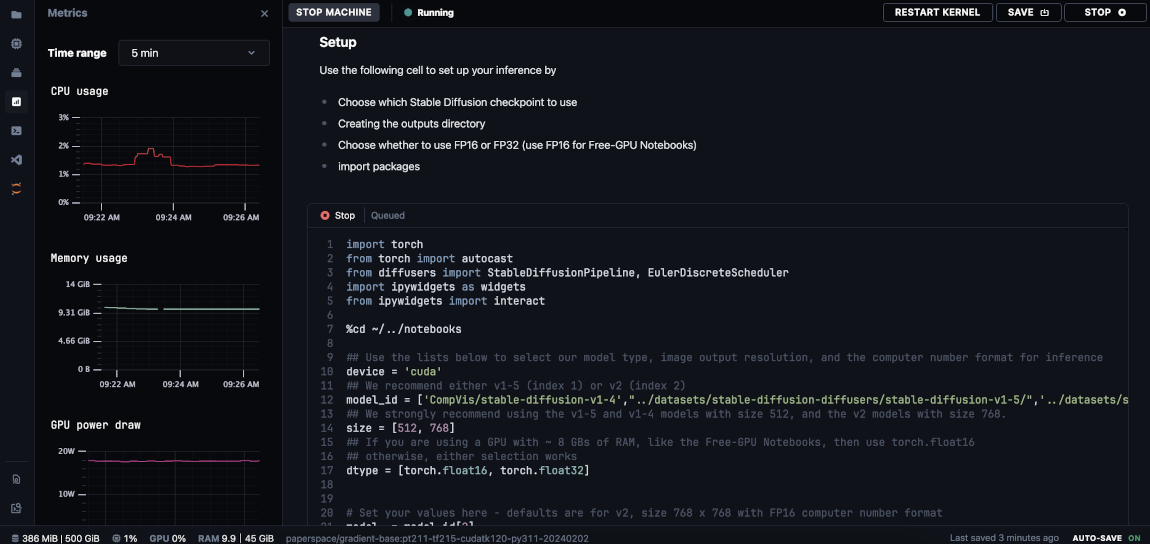
Gradient logs three different kinds of metrics: hardware metrics, framework metrics, and custom user metrics. For Gradient Notebooks, Gradient monitors and tracks CPU usage, RAM usage, and GPU performance metrics such as power consumption, temperature, utilization, and memory usage.
View Gradient Notebooks Metrics in the Paperspace Console
In the Paperspace console, in the top-left corner, click the drop-down menu, then click GRADIENT. In the Projects section, select the project with the Gradient Notebook you want to view. Within your project, click the Notebooks tab, then select the Gradient Notebook you want to view metrics for. In your Gradient Notebook’s page, in the left sidebar menu, click the Metrics button to view your Gradient Notebook’s metrics.
View Gradient Notebooks Metrics Using the Paperspace CLI
Using the Paperspace CLI, run the gradient command to query your Gradient Notebook metrics.
Usage: gradient notebooks metrics [OPTIONS] COMMAND [ARGS]...

  Read notebooks metrics

Options:
  --help  Show this message and exit.

Commands:
  get     Get notebooks metrics
  stream  Watch live notebooks metrics