You may notice gaps in your metrics data due to outages, platform maintenance, or a database failover or migration. You can check DigitalOcean’s status page for outages, review the cluster maintenance window, or visit the cluster’s Logs (or Logs & Queries) page to look for failovers and migrations.
How to Monitor OpenSearch Database Cluster Performance
Last verified 13 Jul 2026
OpenSearch is an open-source search and analytics suite which serves as a centralized location to manage logs forwarded from other resources, such as databases and Droplets.
DigitalOcean Managed Databases include metrics visualizations so you can monitor performance and health of your database cluster.
-
Cluster metrics monitor the performance of the nodes in a database cluster. Cluster metrics cover primary and standby nodes; metrics for each read-only node are displayed independently. This data can help guide capacity planning and optimization. You can also set up alerting on cluster metrics.
-
Database metrics monitor the performance of the database itself. This data can help assess the health of the database, pinpoint performance bottlenecks, and identify unusual use patterns that may indicate an application bug or security breach.
View Performance Metrics
To view performance metrics, go to the Databases page and select the cluster whose metrics you want to view. On the cluster’s Overview page, click the Insights tab.
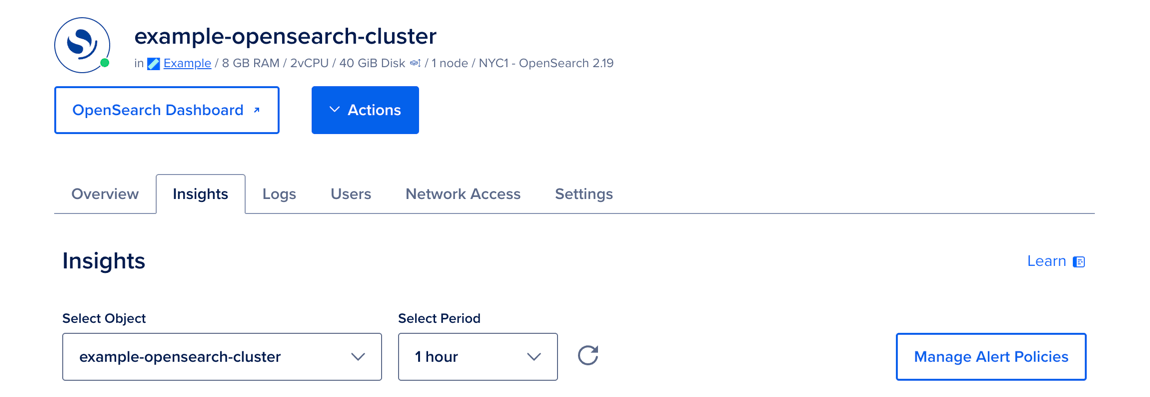
In the Select Object dropdown menu, choose the cluster to view cluster metrics, or choose a database to view database-specific metrics.
In the Select Period dropdown menu, you can choose a time frame for the x-axis of the graphs, ranging from 1 hour to 14 days. Each line in the graphs displays about 300 data points.
If you recently provisioned the cluster or changed its configuration, it may take a few minutes for the metrics data to finish processing before you see it on the Insights page.
If you have 200 or more databases on a single cluster, you may be unable to retrieve their metrics. If you reach this limit, create additional databases in a new cluster.
Cluster Metrics Details
Database clusters have the following cluster metrics:
- CPU usage
- 1-, 5-, and 15-minute load average
- Memory usage
- Disk usage
All resource usage graphs have three lines for minimum, maximum, and average. If you have a one-node cluster or are viewing a read-only node, all three lines are a single, superimposed line. Read-only node metrics are displayed independently from clusters which are comprised of primary and standby nodes.
CPU Usage
The CPU usage graph shows, for all nodes in the cluster, the minimum, maximum, and average percentage of processing power being used across all cores.
If you experience a significant increase in CPU usage, check the throughput graph and query statistics to look for unexpected usage patterns or long-running queries.
Learn more in the Droplet CPU metrics definitions.
Load Average
The load average graph displays 1-, 5-, and 15-minute load averages, averaged across all primary and standby nodes in the cluster. Load average measures the processes that are either being handled by the processor or are waiting for processor time.
The three time-based load average metrics are calculated as an exponentially weighted moving average over the past 1, 5, and 15 minutes. This metric does not adjust for multiple cores. Learn more in the Droplet load average metrics definitions.
Memory Usage
The memory usage graph presents the minimum, maximum, and average percentage of memory consumption across all nodes in the cluster. Because cached memory can be released on demand, it is not considered in use.
Learn more in the Droplet memory usage metrics definitions.
Disk Usage
The disk usage graph shows the minimum, maximum, and average percentage of disk consumed across all primary and standby nodes in the cluster. You should maintain disk usage below 90%.
Learn more in the Droplet disk I/O metrics definitions.
OpenSearch Metrics Details
OpenSearch databases expose the following additional metrics:
- HTTP Requests: the rate of HTTP requests handled by the cluster
- Document Operations: the rate of document index, delete, and get operations
- Total Documents: the total number of documents stored across all indices
- Total Indices: the total number of indices in the cluster
- Total Indices Size: the total storage size of all indices in the cluster
- Search Operations: the rate of search query and fetch operations
- Shard Health: the number of active, relocating, initializing, and unassigned shards
HTTP Requests
The HTTP requests graph displays the rate of HTTP requests processed by the cluster.
Document Operations
The document operations graph displays the rate of document-level operations, including indexing, deleting, and retrieving documents.
Total Documents
The total documents graph displays the total number of documents stored across all indices in the cluster.
Total Indices
The total indices graph displays the total number of indices in the cluster.
Total Indices Size
The total indices size graph displays the combined storage size of all indices in the cluster.
Search Operations
The search operations graph displays the rate of search queries and fetch operations across the cluster.
Shard Health
The shard health graph displays the number of shards in each state: active, relocating, initializing, and unassigned. A healthy cluster should have zero unassigned shards.
Access the Metrics Endpoint
You can also view your database cluster’s metrics programmatically via the metrics endpoint. This endpoint includes over twenty times the metrics you can access in the Insights tab in the control panel.
You can access the metrics endpoint with a cURL command or a monitoring system like Prometheus.
Get Hostname and Credentials
First, you need to retrieve your cluster’s metrics hostname by sending a GET request to https://api.digitalocean.com/v2/databases/${UUID}. In the following example, the target database cluster has a standby node, which requires a second host/port pair:
curl --silent -XGET --location 'https://api.digitalocean.com/v2/databases/${UUID}' --header 'Content-Type: application/json' --header "Authorization: Bearer $RO_DIGITALOCEAN_TOKEN" | jq '.database.metrics_endpoints'Which returns the following host/port pairs:
[
  {
    "host": "db-test-for-metrics.c.db.ondigitalocean.com",
    "port": 9273
  },
  {
    "host": "replica-db-test-for-metrics.c.db.ondigitalocean.com",
    "port": 9273
  }
]
Next, you need your cluster’s metrics credentials. You can retrieve these by making a GET request to https://api.digitalocean.com/v2/databases/metrics/credentials with an admin or write token:
curl --silent -XGET --location 'https://api.digitalocean.com/v2/databases/metrics/credentials' --header 'Content-Type: application/json' --header "Authorization: Bearer $RW_DIGITALOCEAN_TOKEN" | jq '.'Which returns the following credentials:
{
  "credentials": {
    "basic_auth_username": "..."
    "basic_auth_password": "...",
  }
}
Access with cURL
To access the endpoint using cURL, make a GET request to https://$HOST:9273/metrics, replacing the hostname, username, and password variables with the credentials you found in the previous steps:
curl -XGET -k -u $USERNAME:$PASSWORD https://$HOST:9273/metricsAccess with Prometheus
To access the endpoint using Prometheus, first copy the following configuration into a file prometheus.yml, replacing the hostname, username, password, and path to CA cert. This configures Prometheus to use all the credentials necessary to access the endpoint:
# prometheus.yml
global:
  scrape_interval: 15s
  evaluation_interval: 15s

scrape_configs:
  - job_name: 'dbaas_cluster_metrics_svc_discovery'
    scheme: https
    tls_config:
      ca_file: /path/to/ca.crt
    dns_sd_configs:
    - names:
      - $TARGET_ADDRESS
      type: 'A'
      port: 9273
      refresh_interval: 15s
    metrics_path: '/metrics'
    basic_auth:
      username: $BASIC_AUTH_USERNAME
      password: $BASIC_AUTH_PASSWORD
Then, copy the following connection script into a file named up.sh. This script runs envsubst and starts a Prometheus container with the config from the previous step:
#!/bin/bash
envsubst < prometheus.yml > /tmp/dbaas-prometheus.yml
docker run -p 9090:9090 \
-v /tmp/dbaas-prometheus.yml:/etc/prometheus/prometheus.yml \
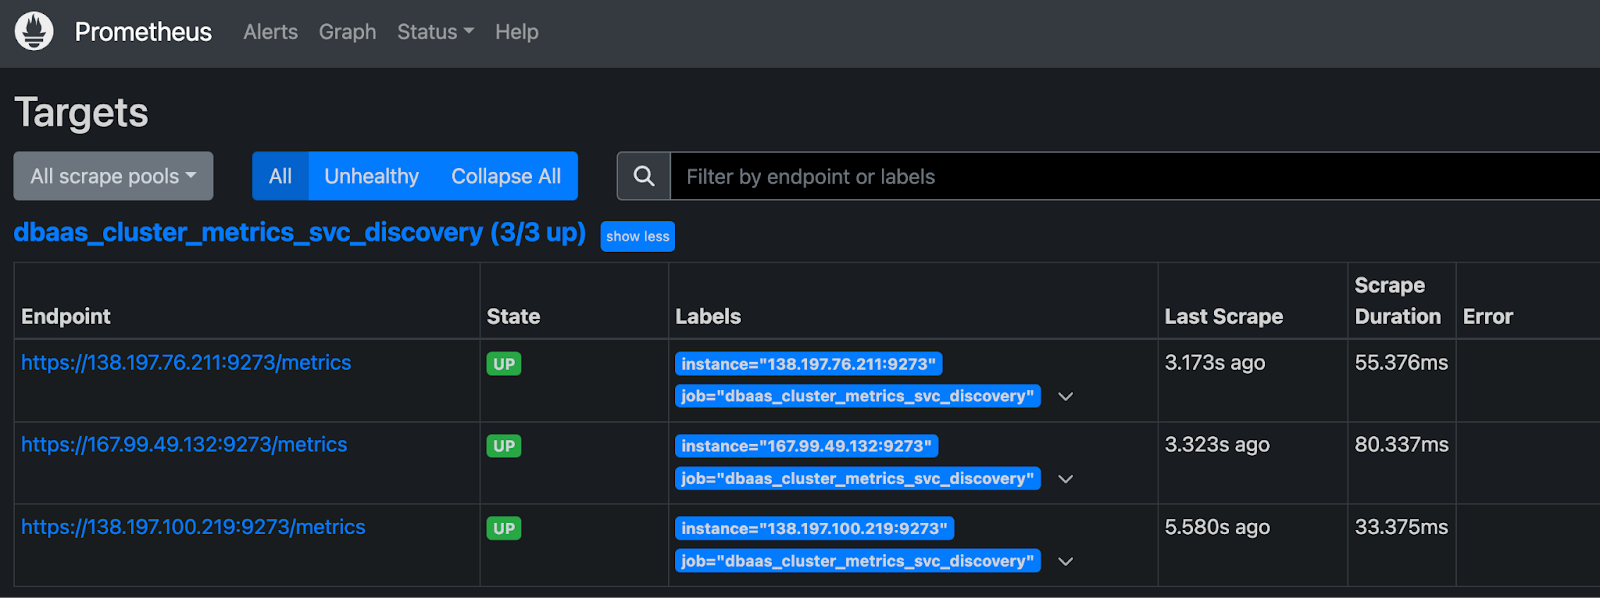
prom/prometheusGo to http://localhost:9090/targets in a browser to confirm that multiple hosts are up and healthy.
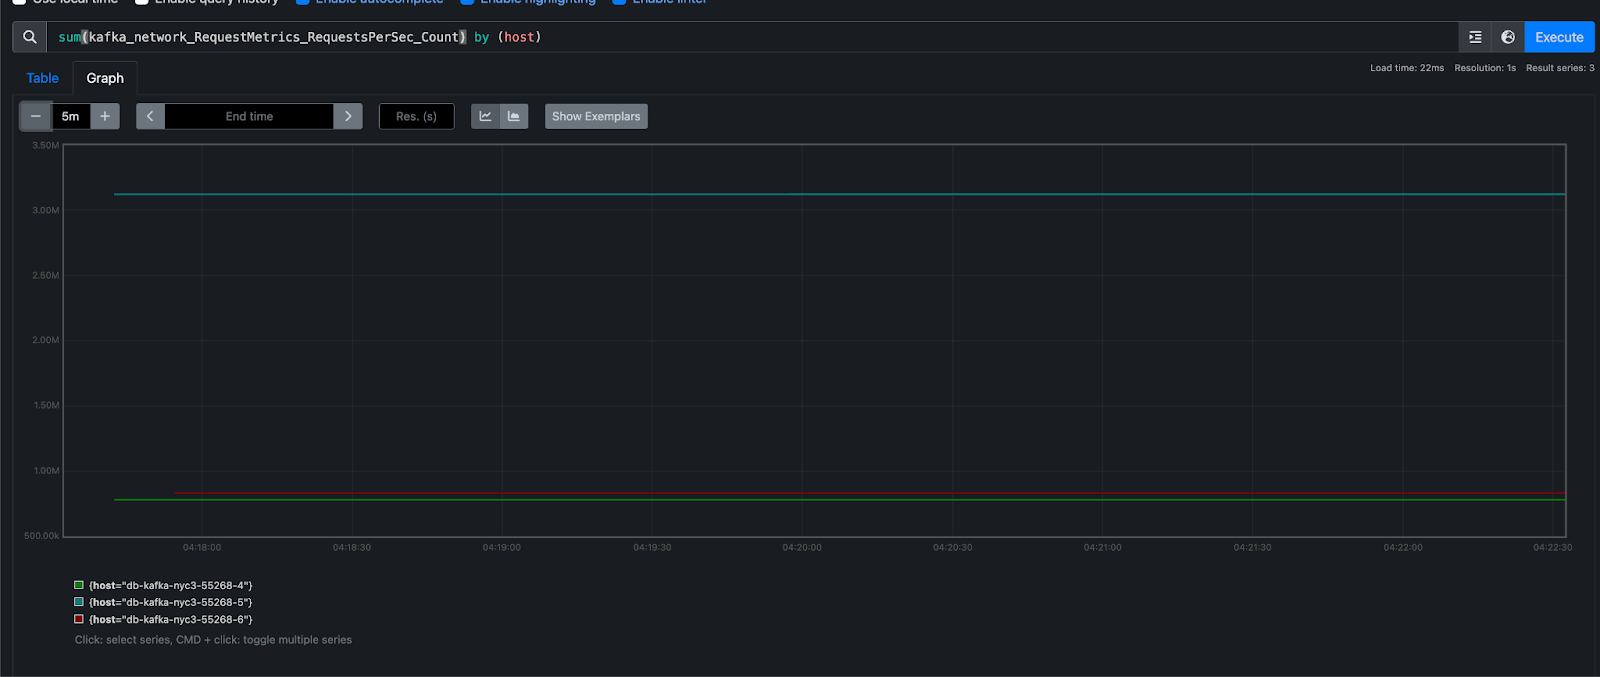
Then, navigate to http://localhost:9090/graph to query Prometheus for metrics.
For more details, see the Prometheus DNS SD docs and TLS config docs.
Additional Resources
For more details on each available metric, see the OpenSearch documentation.