You may notice gaps in your metrics data due to outages, platform maintenance, or a database failover or migration. You can check DigitalOcean’s status page for outages, review the cluster maintenance window, or visit the cluster’s Logs (or Logs & Queries) page to look for failovers and migrations.
How to Monitor MongoDB Database Cluster Performance
Last verified 13 Jul 2026
MongoDB is a source-available cross-platform document-oriented database program for high-volume storage. Classified as a NoSQL database program, MongoDB uses JSON-like documents with optional schemas.
DigitalOcean Managed Databases include metrics visualizations so you can monitor performance and health of your database cluster.
Cluster metrics monitor the performance of the nodes in a database cluster. This data can help guide capacity planning and optimization. You can also set up alerting on cluster metrics.
View Performance Metrics
To view performance metrics, go to the Databases page and select the cluster whose metrics you want to view. On the cluster’s Overview page, click the Insights tab.
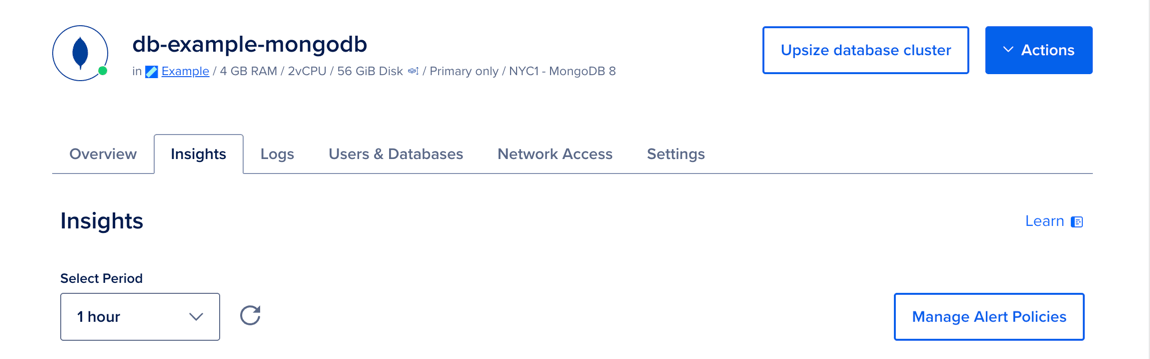
In the Select Period dropdown menu, you can choose a time frame for the x-axis of the graphs, ranging from 1 hour to 14 days. Each line in the graphs displays about 300 data points.
If you recently provisioned the cluster or changed its configuration, it may take a few minutes for the metrics data to finish processing before you see it on the Insights page.
Cluster Metrics Details
Database clusters have the following cluster metrics:
- CPU usage
- 1-, 5-, and 15-minute load average
- Memory usage
- Disk usage
All resource usage graphs have three lines for minimum, maximum, and average. If you have a one-node cluster, all three lines are a single, superimposed line.
CPU Usage
The CPU usage graph shows, for all nodes in the cluster, the minimum, maximum, and average percentage of processing power being used across all cores.
If you experience a significant increase in CPU usage, check the MongoDB throughput graph and query statistics to look for unexpected usage patterns or long-running queries.
Learn more in the Droplet CPU metrics definitions.
Load Average
The load average graph displays 1-, 5-, and 15-minute load averages, averaged across all nodes in the cluster. Load average measures the processes that are either being handled by the processor or are waiting for processor time.
The three time-based load average metrics are calculated as an exponentially weighted moving average over the past 1, 5, and 15 minutes. This metric does not adjust for multiple cores. Learn more in the Droplet load average metrics definitions.
Memory Usage
The memory usage graph presents the minimum, maximum, and average percentage of memory consumption across all nodes in the cluster. Because cached memory can be released on demand, it is not considered in use.
Learn more in the Droplet memory usage metrics definitions.
Disk Usage
The disk usage graph shows the minimum, maximum, and average percentage of disk consumed across all nodes in the cluster. Disk usage is expected to fluctuate during vacuuming, particularly with write-heavy use cases, but you should maintain disk usage below 90%.
Learn more in the Droplet disk I/O metrics definitions.