How to View the Uptime Check Dashboard
Last verified 13 Jul 2026
DigitalOcean Uptime is a monitoring service that checks the health of any URL or IP address. Use Uptime to monitor the latency, uptime, and SSL certificates of any website or host, and receive email or Slack alerts at thresholds you choose.
Each Uptime check has a dashboard with detailed information about uptime, latency, SSL expiry, and configured alerts. To navigate to an Uptime check’s dashboard, click the check’s name on the Uptime page in the control panel.
The status page is broken down into three major sections:
Summary Cards
At the top of the dashboard, there are three cards that provide summaries of critical information: 30 Day Global Uptime, SSL Certificate Expiry, and Last Outage / Duration.
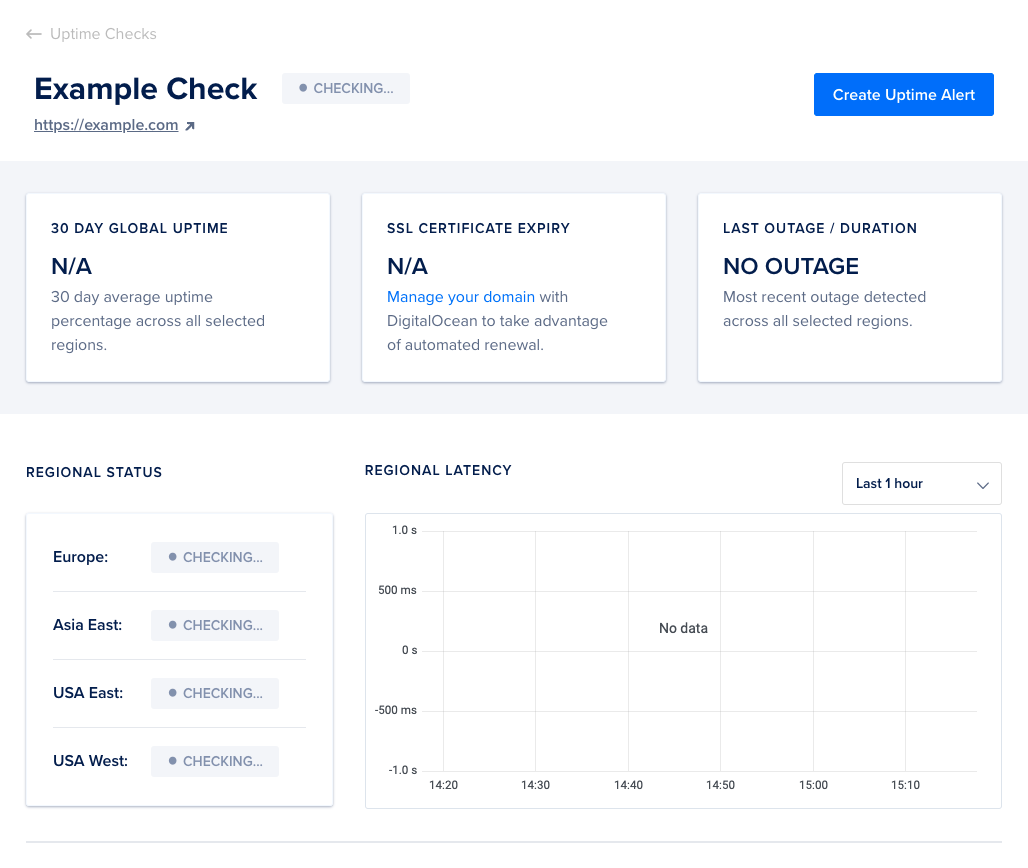
- 30 Day Global Uptime: Shows the 30-day average uptime percentage across all selected regions.
- SSL Certificate Expiry: Shows the number of days until the site’s SSL certificate expires. For HTTP and PING checks, this always shows as N/A.
- Last Outage / Duration: Shows location and duration of the most recent outage.
Regional Status and Latency
The next section shows detailed regional uptime information and latency graphs.
Regional Status
The Regional Status section shows Up/Down status indicators for each selected check region, as well as how long connectivity from each region has been up or down.
Regional Latency
The Regional Latency graph shows a plot of latency in each selected region, for the time period specified in the drop-down menu. The time period defaults to Last 1 hour. Times are shown using a 24-hour format in the time zone specified by your browser.
You can zoom in on a particular section of the graph by clicking and dragging over the desired slice of time. Double-clicking the graph zooms you back out one level. You can also reset your view by selecting the desired time period in the drop-down menu.
Settings and Alerts
The third section of the status page shows the Uptime check’s settings, along with any alerts you’ve configured.
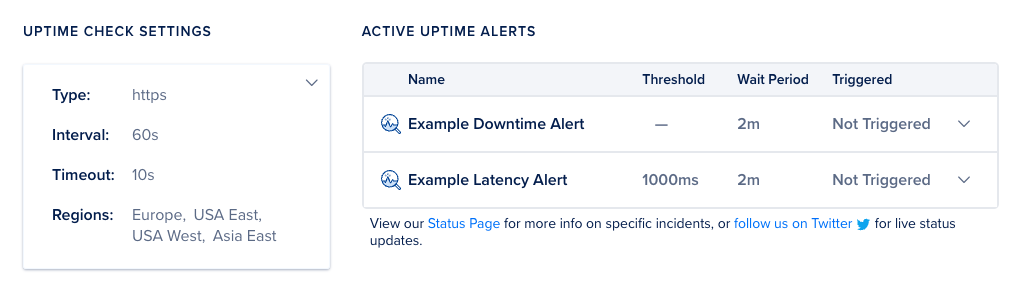
Uptime Check Settings
The Uptime Check Settings card shows the following information:
- Type: the type of check being performed: HTTPS, HTTP, or PING
- Interval: how often, in seconds, an uptime check is performed (not configurable)
- Timeout: the length of time, in seconds, before an uptime check times out (not configurable)
- Regions: the regions selected to perform checks
Active Uptime Alerts
The Active Uptime Alerts section shows a list of alerts set up for this check. The table shows details about the alert, along with a Triggered/Not Triggered status message. To edit or delete an alert, use the drop-down menu on the right-hand side of the table. For more detailed steps, see How to Edit Alerts and How to Destroy Alerts.