Kubernetes sets aside CPU and memory for system processes, which may be greater than the CPU and memory that is actually in use. See the advanced metrics guidance for details on how to visualize reserved CPU and memory.
How to View Basic Performance Metrics for Nodes in DigitalOcean Kubernetes Clusters
Last verified 5 Mar 2026
DigitalOcean Kubernetes (DOKS) is a Kubernetes service with a fully managed control plane, high availability, and autoscaling. DOKS integrates with standard Kubernetes toolchains and DigitalOcean’s load balancers, volumes, CPU and GPU Droplets, API, and CLI.
DigitalOcean Kubernetes includes metrics visualizations to provide insight into the health of your Kubernetes clusters and deployments.
-
Basic metrics include CPU usage, load averages, bandwidth, and disk I/O.
Additional metrics, such as GPU utilization, memory, temperature, and power usage, are automatically available for AMD and NVIDIA GPU node pools on DOKS 1.33.1-do.5 or higher when using AI/ML Ready images.
These GPU metrics appear in the Insights tab and provide the same level of observability as GPU Droplets.
Basic metrics are useful for capacity planning and identifying unhealthy worker nodes. For example, you can set up alerting for worker node metrics.
Basic metrics are available by default for clusters, node pools, and worker nodes because all Kubernetes clusters come with the DigitalOcean metrics agent, a lightweight, open-source service that forwards metrics to the DigitalOcean’s Prometheus backend.
-
Advanced metrics include deployment status metrics, like DaemonSet pod scheduling and availability. Advanced metrics are useful for in-depth views into Kubernetes-specific metrics.
To use advanced monitoring, you need to install the sidecar agent
kube-state-metrics.
View Basic Performance Metrics
To view basic performance metrics, click the name of the cluster to go to its Overview page, then click the Insights tab.
Use the Select object drop-down to switch between cluster, node pool, and worker node metrics views.
Use the Select period drop-down to change between metrics time frames, from 1 hour to 30 days. Each graph will display approximately 300 data points.
By default, the summary to the right shows the most recent metrics values. If you hover over a time point on one of the graphs, the summary will display the values from that time point instead.
If you recently created a cluster, node pool, or worker node, it may take a few minutes for the metrics data to finish processing before you see it on the Insights page.
Kubernetes Basic Metrics Details
DigitalOcean’s basic Kubernetes monitoring includes the following metrics:
- CPU usage
- 1-, 5-, and 15-minute load average
- Memory usage
- Disk usage
- Disk I/O
- Bandwidth (public and private)
For DOKS 1.33.1-do.5 and later, Insights displays the following GPU-level metrics for AMD and NVIDIA GPU node pools created using AI/ML Ready images:
- GPU utilization
- GPU memory utilization
- GPU temperature
- GPU power usage
Basic metrics are available for clusters, node pools, and worker nodes. For clusters and node pools, metrics are rolled up across all worker nodes and summary metrics are reported.
CPU Usage
For worker nodes, the CPU usage plot displays the amount of processing power being consumed across all cores. For clusters and node pools, it displays the minimum, maximum, and average percentage of processing power being used across all worker nodes and cores.
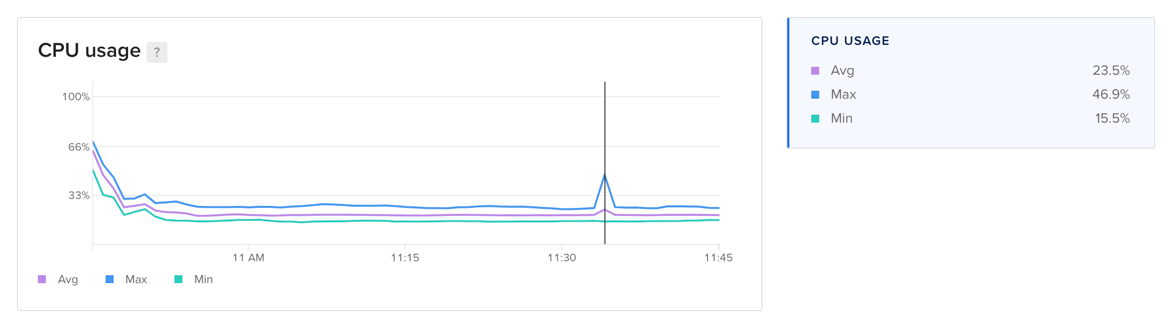
Learn more about CPU usage in the Droplet metrics definitions.
Load Average
The load average plot displays 1-, 5-, and 15-minute load averages, averaged across all worker nodes for cluster and node pool views. Load average measures the processes that are either being handled by the processor or are waiting for processor time.
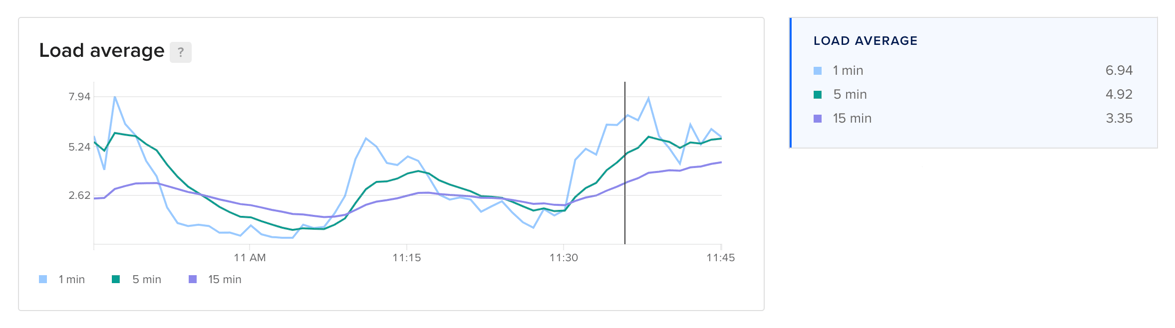
The three time-based load average metrics are calculated as an exponentially weighted moving average over the past 1, 5, and 15 minutes. This metric does not adjust for multiple cores. Learn more about load averages in the Droplet metrics definitions.
Memory Usage
For worker nodes, the memory usage plot displays the percentage of memory in use. For clusters and node pool, it displays the minimum, maximum, and average percentage of memory consumption across all worker nodes. Because cached memory can be released on demand, it is not considered in use.
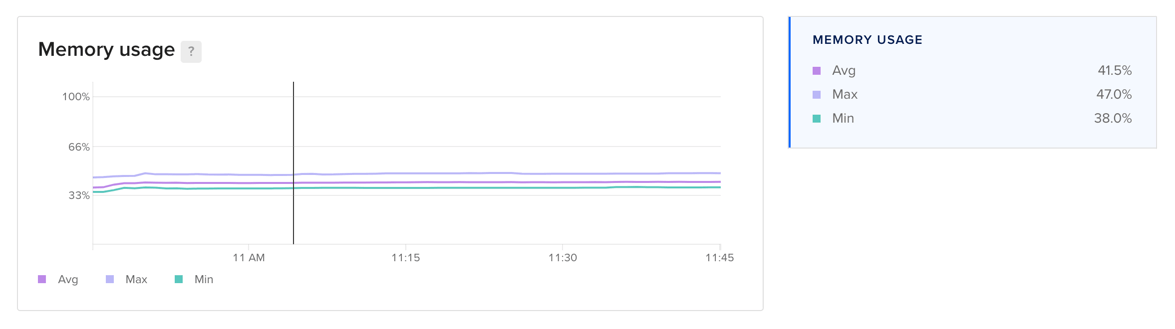
Learn more about memory usage in the Droplet metrics definitions.
Disk Usage
The disk usage plot displays the percentage of disk used on a worker node. For clusters and node pools, the plot displays the minimum, maximum, and average percentage of disk consumed across all worker nodes.
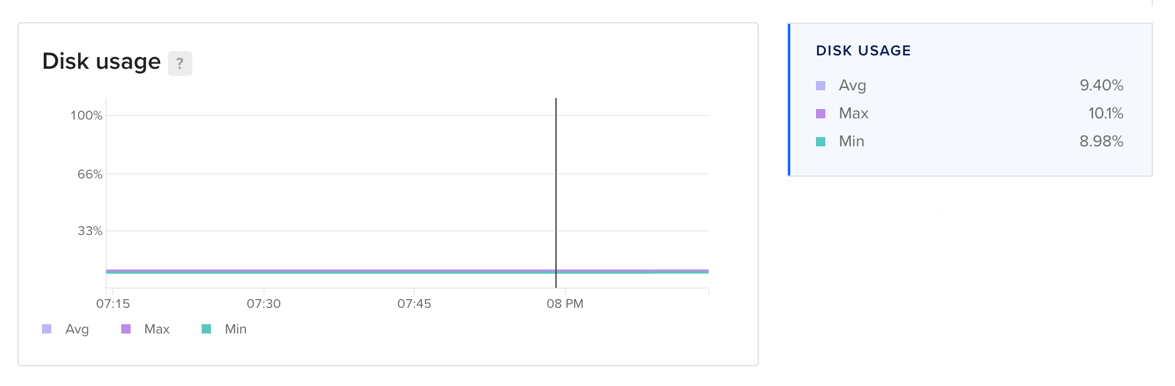
Learn more about disk usage in the Droplet metrics definitions.
Disk I/O
For worker nodes, the disk I/O plot displays the rate at which data is read and written to disk. For clusters and node pools, it presents the maximum and average rate that data is being read and written across all worker nodes in the cluster or node pool. The rate is expressed in megabytes per second.
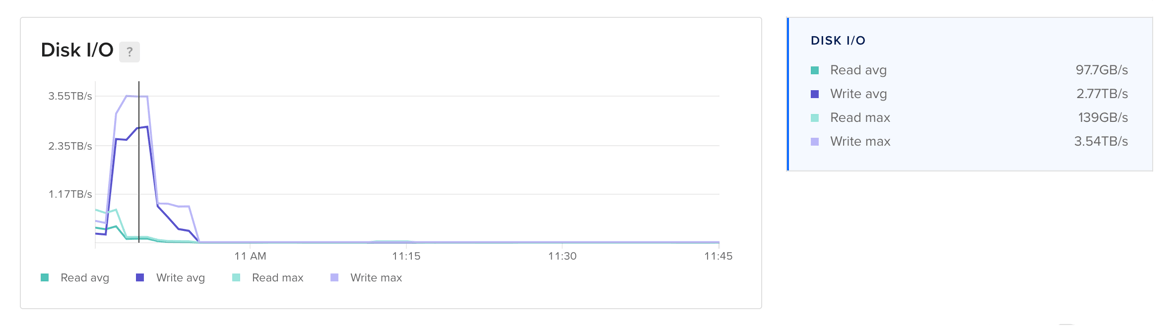
Learn more about disk I/O in the Droplet metrics definitions.
Bandwidth
For worker nodes, the bandwidth plots display the average rate at which data moves between the worker nodes in the cluster or node pool and other resources. For clusters and node pools, they display the average and maximum incoming and outgoing bandwidth across all worker nodes.
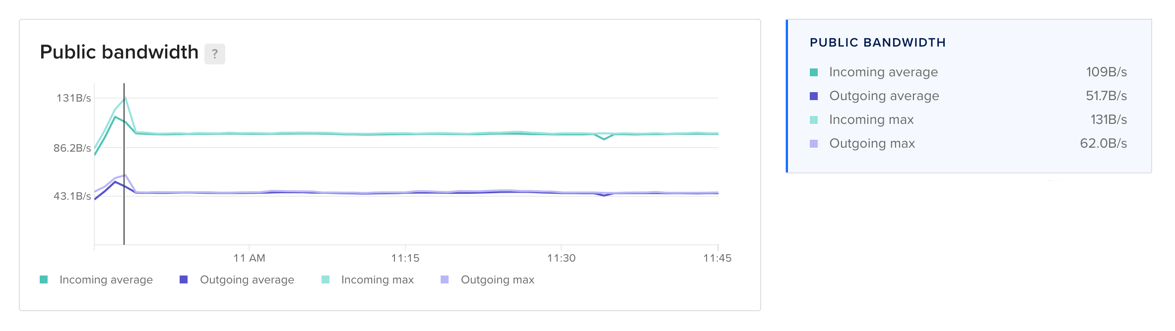
There are separate plots for public and private network bandwidth with lines for both incoming and outgoing bandwidth. The rate is expressed in megabits per second.
Learn more about bandwidth in the Droplet metrics definitions.