How to Connect to a Machine
Validated on 7 Aug 2024 • Last edited on 22 Jan 2026
Machines are Linux and Windows virtual machines with persistent storage, GPU options, and free unlimited bandwidth. They’re designed for high-performance computing (HPC) workloads.
You can connect to your Linux or Windows-based machine using the Paperspace console or desktop app using SSH connection. For Windows-based machines, you can connect to your machine by desktop streaming or using third-party tools like RDP, TeamViewer, VNC, and others.
If you’re planning to use a third-party tool to connect to your Windows-based machine, such as Windows’ Remote Desktop Protocol (RDP), refer to their documentation as needed. Desktop streaming is only available for your Windows-based machines.
You cannot use either the Paperspace API and CLI to connect to your machine. If you want to connect to your machine, you must use the Paperspace console.
Connect to Your Machine Using the Paperspace Console
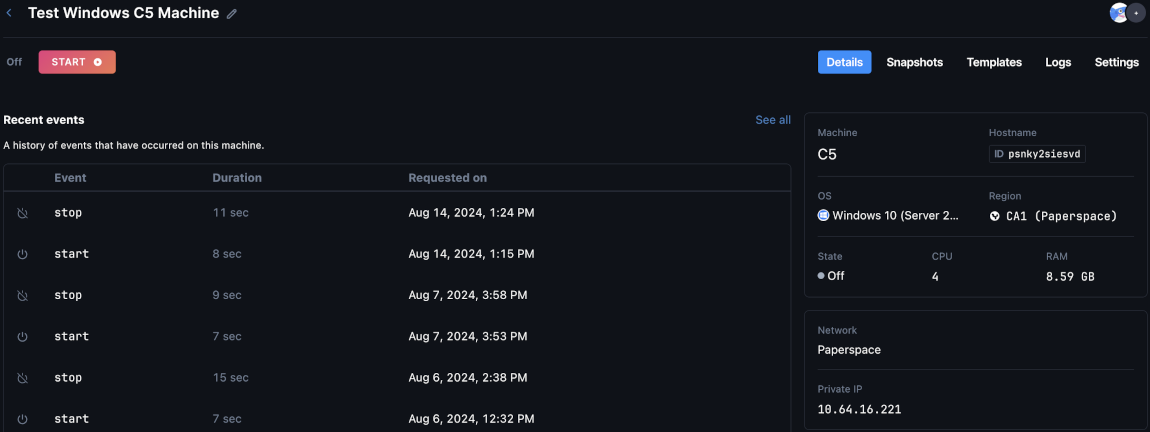
To connect to your machine, go to the Paperspace console, in the top-right corner, click the drop-down menu, select CORE, then click the Machines tab. In the Machines section, find and select the machine you want to connect to. In the machine’s overview page, click the Details tab, then click START. This changes the machine state from Off to Starting up and the START button to CONNECT.

Once the Starting up state changes to On/Ready, in the machine’s overview page, under the SHUTDOWN and RESTART buttons, in the Access your machine sub-section, copy the SSH command used to connect to your machine.
On your local machine, open a terminal, paste the command you copied, and execute it. The terminal should either prompt you to set up an SSH connection to your new machine or immediately display the welcome screen, indicating that you have connected to your machine. If you are connecting to your machine for the first time, then you need to set up your SSH connection.
If you don’t see the welcome screen and/or are unable to connect to your machine, contact Paperspace support.
Connect to Your Machine Using the Desktop App
If you want to use the desktop app to connect to your machine, you need to have a Paperspace account. You need to also download and install the desktop app on your local machine. On your local machine, launch the desktop app, then in the desktop app, log in to your Paperspace account.
After you have successfully logged into your Paperspace account, you should see your Paperspace account within the desktop app, which mirrors the experience on the Paperspace console.
Follow the Connect to Your Machine Using the Paperspace Console section to connect to your machine through the desktop app.
Connect to Your Machine via Desktop Streaming
To connect to your machine via desktop streaming, go to the Paperspace console, in the top-right corner, click the drop-down menu, select CORE, then click the Machines tab. In the Machines section, find and select the machine you want to connect to. In the machine’s overview page, click the Details tab, then click START. This changes the machine state from Off to Starting up and the START button to CONNECT.

Once the Starting up state changes to On/Ready, in the machine’s overview page, under the SHUTDOWN and RESTART buttons, in the Stream your desktop sub-section, click OPEN DESKTOP to open your streamed desktop in a new browser tab.
Test Your Connectivity
You can test your machine’s latency and connectivity to Paperspace by running a speed test, a ping test, and a traceroute to the public IP address of your machine’s datacenter.
Each datacenter region has a public IP address:
NY2:184.105.3.1CA1:64.62.255.1AMS1:74.82.28.1
To test your machine’s latency and connectivity, go to the Paperspace console, in the top-right corner, click the drop-down menu, select CORE, then click the Machines tab. In the Machines section, connect to the machine you want to test.
Test Using a Speed Test Website
You can test your machine’s latency using an online speed test, like https://www.speedtest.net. Choose a server in a location closest to your machine’s datacenter region, then run the test. For example, if your Paperspace machine’s datacenter region is NY2, then find a location closest to the east coast.
Test Using ping
To test your machine’s latency using ping, open a terminal and run ping with the number of pings you want to output (like -c 5 for five pings) and the datacenter’s IP address. For example, to check your machine’s ping for the NY2 datacenter region, use the following command:
ping -c 5 184.105.3.1Your terminal should output your machine’s ping at the end of each line.
PING 184.105.3.1 (184.105.3.1): 56 data bytes
64 bytes from 184.105.3.1: icmp_seq=0 ttl=56 time=93.680 ms
...
Test Using traceroute
For Windows-based machines, open a terminal, then run the tracert command alongside the number of hops you want to trace, which limits the maximum number of intermediate hops to display, and your machine’s datacenter region’s IP address. For example, when testing your machine’s latency to the NY2 datacenter region, this tracert command specifies that you want to trace five hops:
tracert -h 5 184.105.3.1Your terminal should display the tracing route of your machine to its datacenter like the output below. You should look at the latency (in ms) after each hop. For example, the first hop (router.local) shows the following latency values: <1 ms, <1 ms, and <1 ms, which indicate that the RTT for the first hop is around 1 ms.
Tracing route to 184.105.3.1 over a maximum of 5 hops

  1    <1 ms    <1 ms    <1 ms  router.local [192.168.1.1]
  2    10 ms    10 ms    10 ms  10.0.0.1
  3    15 ms    15 ms    15 ms  192.168.2.1
  4    20 ms    20 ms    20 ms  isp-gateway.example.com [203.0.113.1]
  5    25 ms    25 ms    25 ms  184.105.3.1
...
On some Linux distributions, traceroute isn’t installed by default. You can install it using your distribution’s package manager, like APT for Ubuntu-based systems (sudo apt-get install traceroute).
For Linux-based machines, open a terminal, then run the traceroute command and specify the IP address of your machine’s datacenter. We recommend also specifying the number of hops you want to trace (for example, -m 5 for five hops), which limits the maximum number of intermediate hops to display.
traceroute -m 5 184.105.3.1Your terminal displays the route your packets take from your machine to its datacenter and the latency of each hop.
In the example below, the first hop to router.local shows 1.009 ms, 1.259 ms, and 1.514 ms of latency, so the round-trip time (RTT) for the first hop is approximately 1.3 ms.
traceroute to 184.105.3.1 (184.105.3.1), 30 hops max, 60 byte packets
 1  router.local (192.168.1.1)  1.009 ms  1.259 ms  1.514 ms
 2  10.0.0.1 (10.0.0.1)  11.234 ms  11.522 ms  11.804 ms
 3  192.168.2.1 (192.168.2.1)  14.331 ms  14.613 ms  14.908 ms
 4  isp-gateway.example.com (203.0.113.1)  21.234 ms  21.516 ms  21.799 ms
 5  184.105.3.1 (184.105.3.1)  25.321 ms  25.604 ms  25.888 ms