GPU metrics are available only on AI/ML Ready images for NVIDIA and AMD GPU Droplets and Kubernetes clusters (DOKS). Basic images don’t include GPU monitoring by default.
GPU Metrics
Last verified 13 Jul 2026
DigitalOcean Monitoring is a free, opt-in service that helps you track Droplet resource usage, view performance metrics, and receive alerts. The DigitalOcean metrics agent is an open-source Go utility that collects and sends system metrics to DigitalOcean to enable features such as usage graphs, alerts, and custom metrics.
GPU metrics help you monitor the health, performance, and reliability of GPU workloads. You can use them to understand resource utilization, detect thermal or power limits, identify communication bottlenecks, and troubleshoot hardware issues.
Metric availability varies by GPU vendor, and some metrics are specific to NVIDIA GPUs or AMD GPUs. Alert policies are not currently supported for GPU metrics.
For information about standard Droplet resource graphs such as CPU, memory, disk, and bandwidth, see Droplet Metrics.
Performance
Performance GPU metric graphs help you monitor how efficiently your workloads use GPU compute and memory resources. These metrics help you identify resource bottlenecks, tune workload performance, and understand whether your GPU is operating near capacity.
Compare GPU occupancy, tensor core utilization, and memory utilization to understand whether performance limits come from compute activity, tensor core acceleration, or VRAM pressure. If you’re using NVIDIA GPUs, reviewing these metrics together can help you determine whether the workload is compute-bound, tensor-core-optimized, or constrained by memory.
GPU Occupancy (NVIDIA GPUs)
GPU occupancy measures how busy the GPU’s compute units are over time, expressed as a percentage (%). It shows how efficiently your workload uses the GPU’s parallel processing cores.
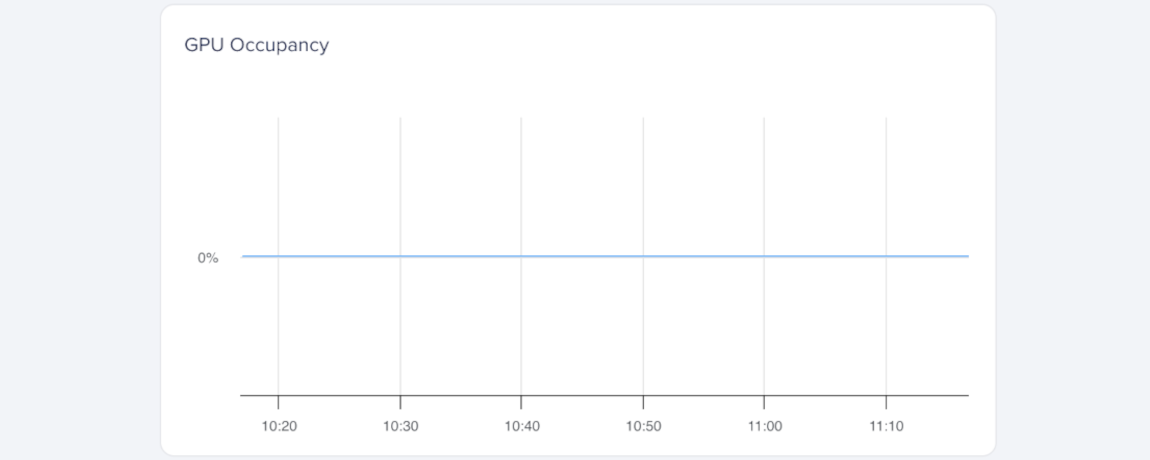
A sustained GPU Occupancy (%) of 100% means your workload fully uses the GPU’s compute resources. Brief spikes are normal during burst activity and don’t necessarily indicate a problem.
GPU Occupancy (%) measures compute unit activity, while GPU Utilization (%) in tools such as nvidia-smi measures total active time.
Tensor Core Utilization (NVIDIA GPUs)
Tensor core utilization measures how often the GPU’s tensor cores are active, expressed as a percentage (%). Tensor cores handle matrix operations used in AI and ML workloads, so this metric is especially useful for deep learning workloads.
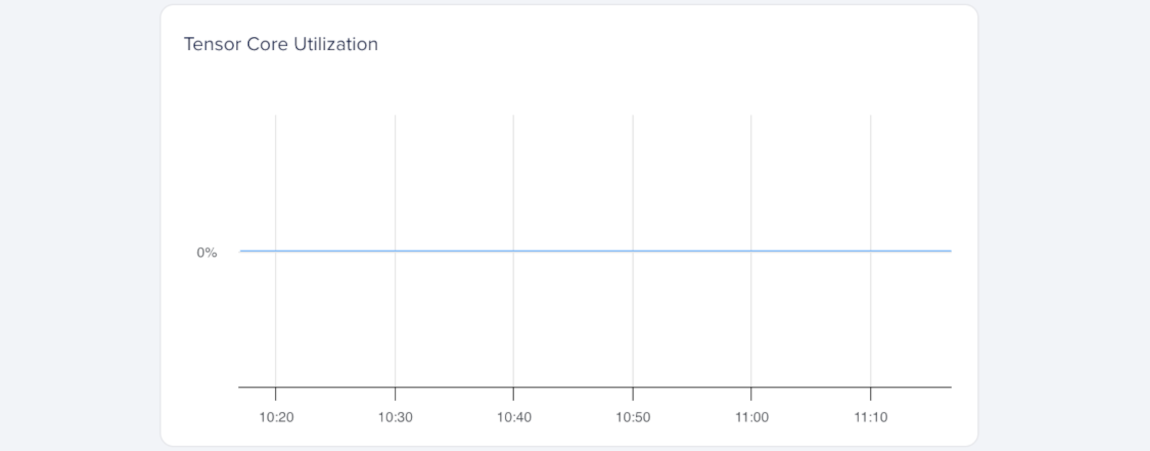
Higher Tensor Utilization (%) means your workload is taking advantage of tensor core acceleration. If the value stays low during ML or inference tasks, your model may not be using tensor operations efficiently.
Memory Utilization
Memory utilization measures how much of the GPU’s total memory (VRAM) is in use, expressed as a percentage (%). It helps you track memory pressure and determine whether your workload fits in available GPU memory.
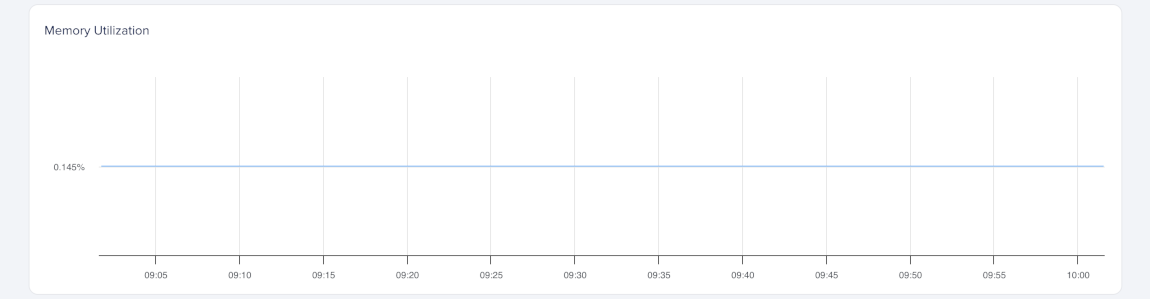
A high memory utilization (%) means most of the GPU’s memory is in use. If the value approaches 100%, the GPU may run out of memory, which can cause errors or reduce performance. If this happens often, consider using smaller batch sizes or models.
Thermal and Power
The thermal and power GPU metric graphs help you monitor GPU heat, throttling, and power consumption. These metrics help you determine whether performance limits come from thermal constraints, power limits, or workload intensity.
Compare temperature, throttling, and power metrics to understand whether performance limits come from heat, power constraints, or workload intensity. If you’re using AMD GPUs, also compare power throttling with thermal throttling and power usage to identify whether the GPU is being constrained by power limits, temperature, or both.
Core Temperature
Core temperature measures the heat of the GPU’s main processing die, expressed in degrees Celsius (°C). It helps you detect overheating that can cause throttling or reduced performance.
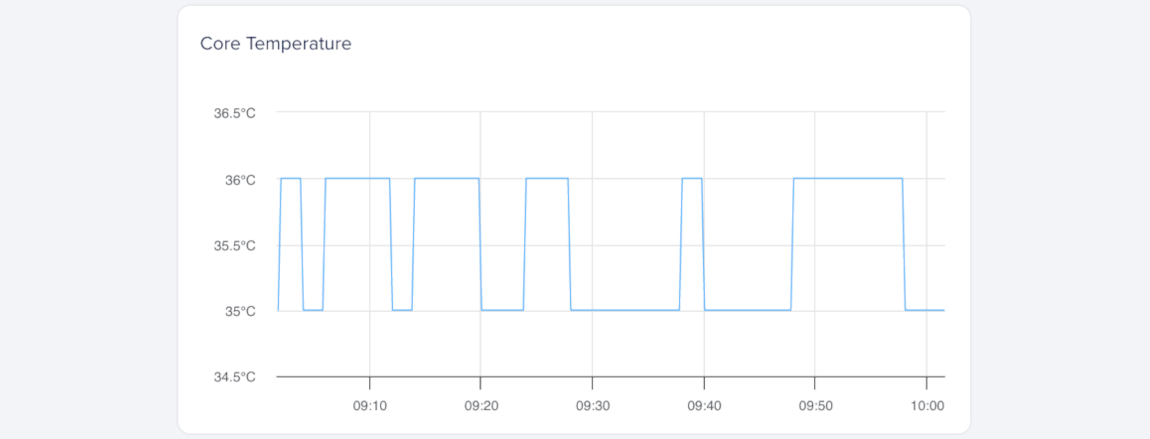
A stable core temperature within the GPU’s rated range indicates normal operation. Consistently high temperatures may cause throttling and reduce workload efficiency.
Memory Temperature
Memory temperature measures the heat of the GPU’s onboard memory modules (VRAM), expressed in degrees Celsius (°C). It helps you detect heat buildup that could affect memory reliability and performance.
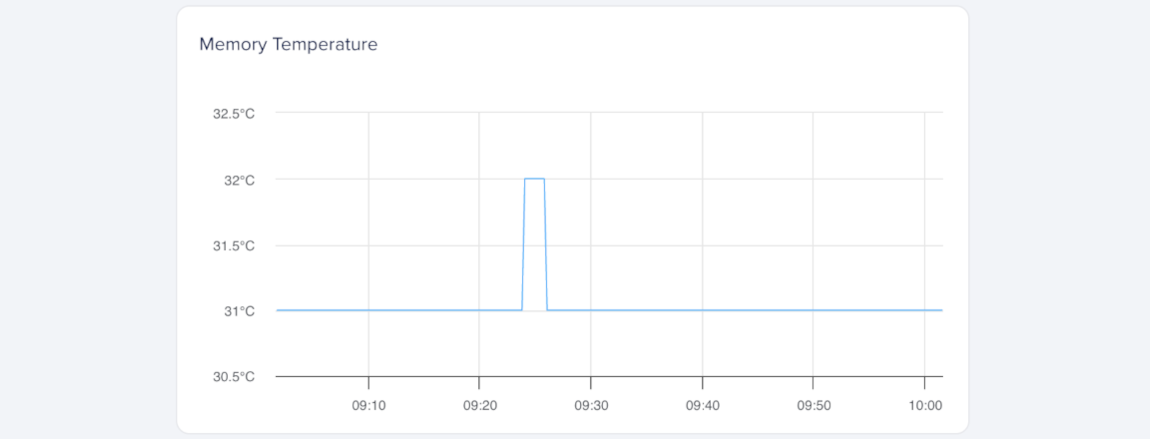
Sustained high memory temperatures can cause throttling or reduce throughput in memory-intensive workloads. Consistently elevated temperatures may reduce performance.
Power Throttling (AMD GPUs)
Power throttling measures how long the GPU reduces performance to stay within its power limits, expressed as a percentage (%). It helps you identify when workloads push the GPU beyond its configured power envelope.
The power throttling GPU metric is currently available only for AMD GPUs. NVIDIA support is planned but not yet available. To use AMD GPUs, contact support to request access.
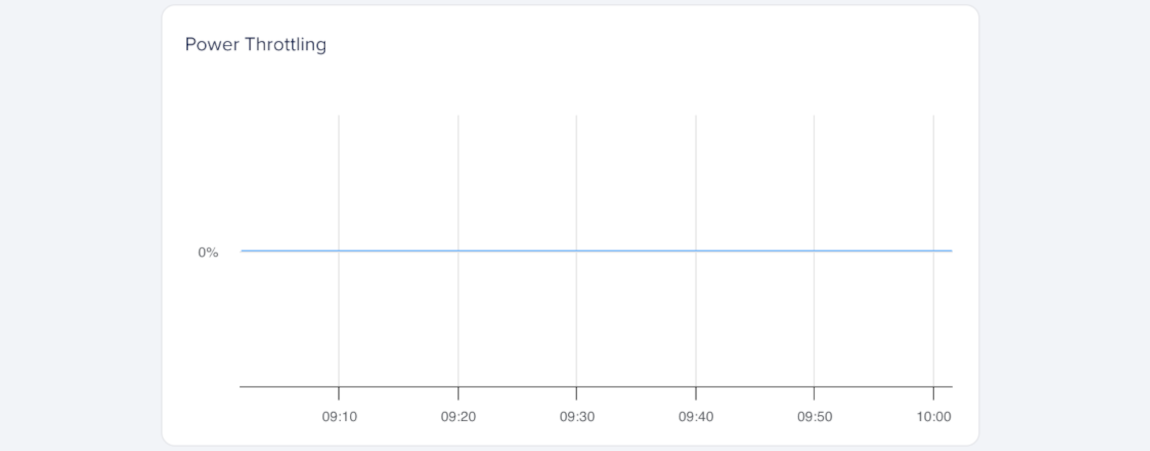
Short bursts of power throttling are normal under heavy load, but sustained or repeated power throttling may mean the GPU is operating near its maximum design power. If this metric rises over time, review your workload’s power demand and consider reducing GPU utilization or enabling power management options.
Thermal Throttling
Thermal throttling measures how long the GPU reduces performance to prevent overheating, expressed as a percentage (%). It helps you detect temperature-related throttling that may affect sustained GPU performance.
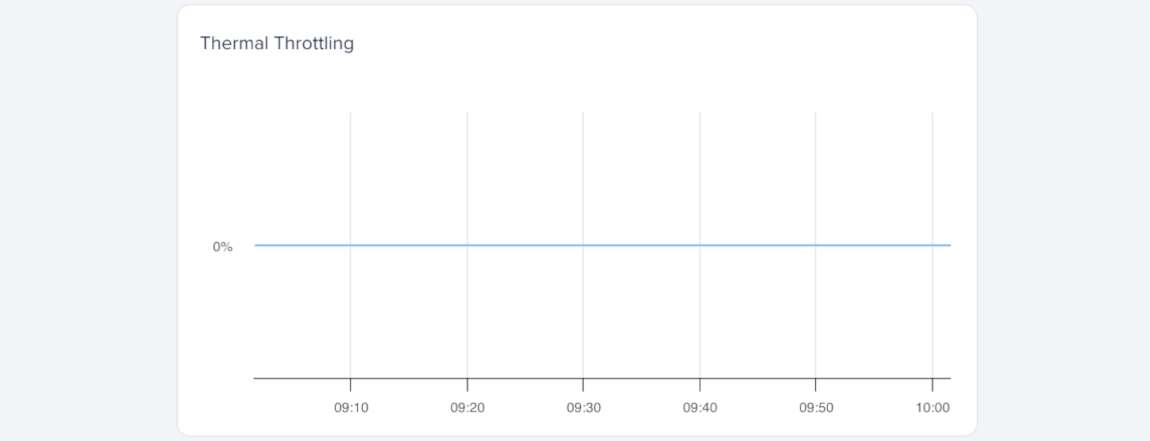
Brief thermal throttling can occur during intensive workloads, but frequent or prolonged throttling usually means the GPU is overheating. If this value rises over time, review workload intensity and cooling conditions.
Power Usage
Power usage measures the GPU’s current power draw in watts (W). It helps you understand how much power your workload uses and whether the GPU operates near its power limits.
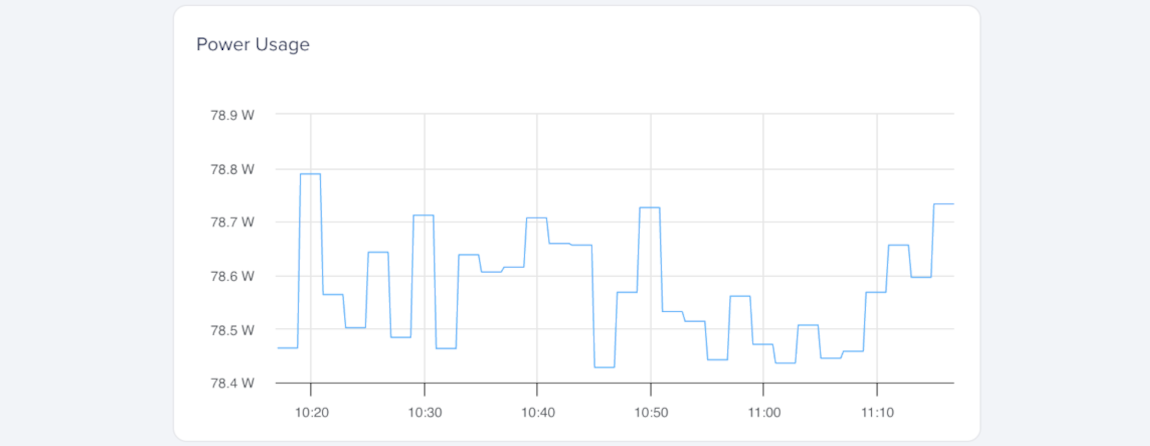
Power usage changes with workload intensity. A steady increase usually indicates sustained GPU activity, while sudden drops or spikes may indicate throttling, idle periods, or transitions between GPU tasks.
Use this metric with temperature and throttling data to determine whether performance limits come from power or thermal constraints.
Interconnect
Interconnect graphs show how data moves between the GPU and the rest of the system, and between GPUs in multi-GPU setups. These metrics help you identify communication bottlenecks that can limit workload performance.
Compare PCIe throughput and interconnect throughput to understand whether data movement between the GPU and host system, or between GPUs, may be limiting workload performance. If you’re using NVIDIA GPUs, comparing both metrics can help you distinguish between PCIe transfer overhead and GPU-to-GPU communication activity.
PCIe Throughput (NVIDIA GPUs)
PCIe throughput measures the data transfer rate between the GPU and the host system over the PCI Express (PCIe) bus, expressed in gigabits per second (Gbps). It helps you understand how much data moves between the GPU and CPU during workload execution.
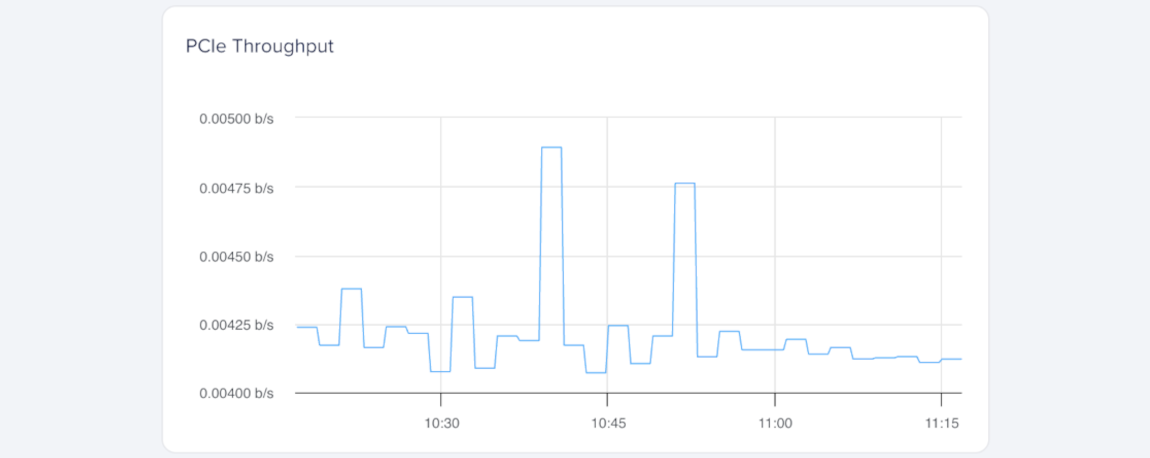
Higher PCIe throughput usually indicates frequent data movement between the GPU and CPU, such as loading models, transferring tensors, or exchanging intermediate results. If throughput stays consistently high, consider optimizing transfers or increasing batch sizes to reduce PCIe overhead.
Interconnect Throughput
Interconnect throughput measures peer-to-peer data transfer between multiple GPUs over NVLink (NVIDIA) or XGMI (AMD), expressed in gigabits per second (Gbps). It shows how efficiently GPUs exchange data in multi-GPU configurations.
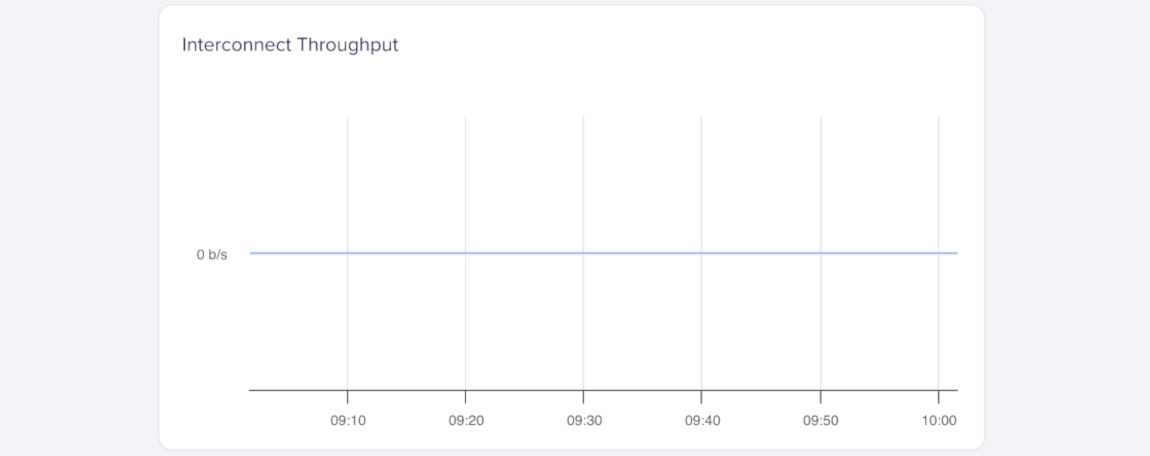
Consistently high NVLink or XGMI throughput indicates strong communication between GPUs, such as during distributed training or parallel computation. If these values drop unexpectedly, check for workload imbalance or driver configuration issues.
Errors
Error metric graphs help you monitor GPU memory reliability and detect hardware issues that may affect workload stability or data integrity. These metrics help you identify memory faults, track recurring hardware problems, and determine whether a GPU may need further investigation or replacement.
Compare error metrics with temperature and power metrics to understand whether hardware faults may be related to heat, power instability, or overall device health.
Uncorrectable ECC Errors
Uncorrectable ECC errors measure the number of double-bit memory errors detected by the GPU’s error-correcting code (ECC) system. This metric helps you identify memory instability or data integrity issues that may affect workload reliability.
A small number of ECC errors can occur over time, especially during sustained or memory-intensive workloads. Frequent or recurring ECC errors may indicate hardware degradation, excessive heat, or unstable power delivery.
If the count continues to rise, monitor temperature trends, check power stability, or replace the GPU to help prevent data corruption.