Kubernetes Metrics Server
Generated on 8 Jul 2025 from the Kubernetes Metrics Server catalog page
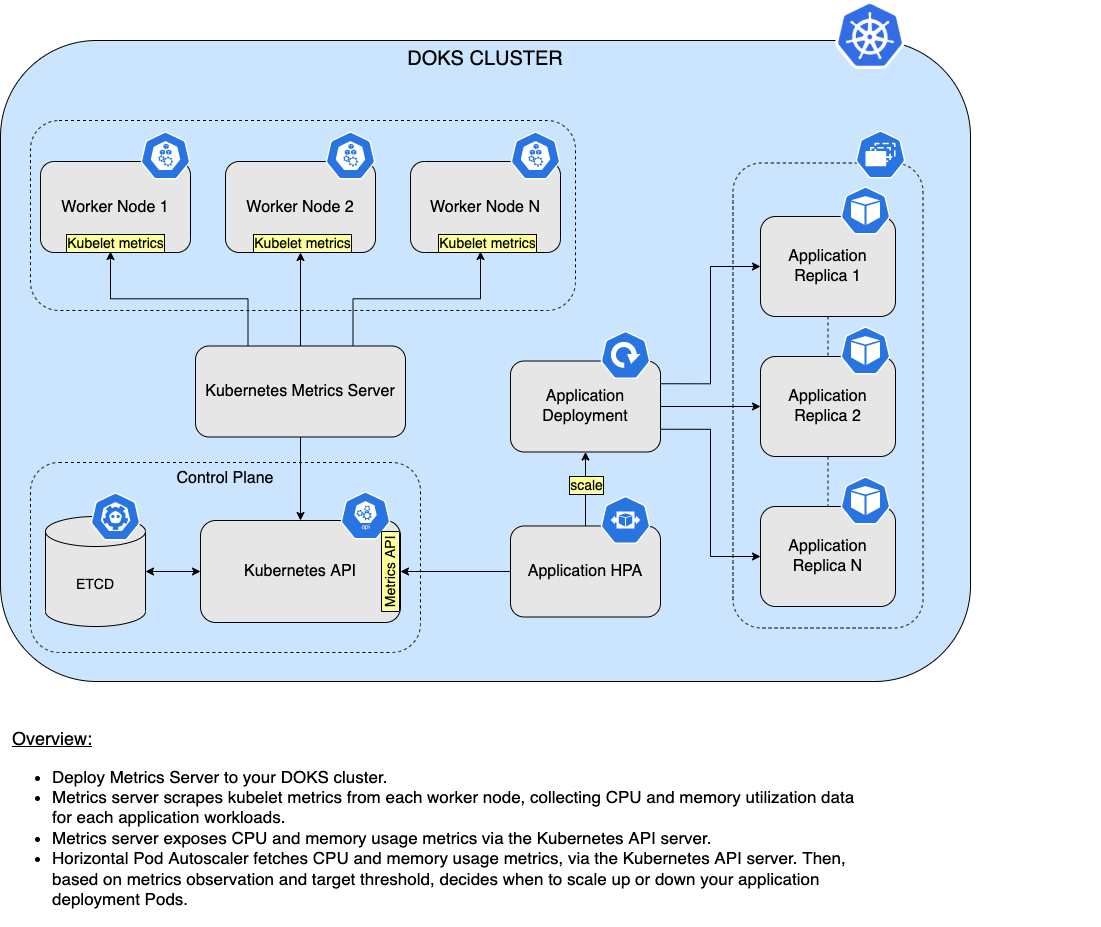
Metrics server is an open source metrics API implementation, created and maintained by the Kubernetes SIG. Main purpose of metrics-server is to help the Kubernetes Horizontal Pod Autoscaler to automatically scale up or down your application workloads based on external factors (such as heavy HTTP traffic). In a nutshell, metrics-server works by collecting resource metrics from Kubelets and exposing them via the Kubernetes API Server to be consumed by the Horizontal Pod Autoscaler (aka HPA). Metrics API can also be accessed by kubectl top, making it easier to debug autoscaling pipelines.
Although you can query metrics-server for resource utilization metrics such as CPU and memory, it’s not advised to do so. This is due to the fact that provided metrics data may not be very accurate. For better results you would want to use a dedicated monitoring solution like Prometheus.
Please make sure to check metrics-server official documentation for more details.
Note:
DigitalOcean is using Helm v3 to deploy metrics-server to your DOKS cluster.
Metrics-Server and HPA Overview Diagram
Below diagram shows a high level overview of how HPA (Horizontal Pod Autoscaling) works in conjunction with metrics-server:
Software Included
| Package | Version | License |
|---|---|---|
| metrics-server | 3.12.2 | Apache 2.0 |
Creating an App using the Control Panel
Click the Deploy to DigitalOcean button to install a Kubernetes 1-Click Application. If you aren’t logged in, this link will prompt you to log in with your DigitalOcean account.

Creating an App using the API
In addition to creating Kubernetes Metrics Server using the control panel, you can also use the DigitalOcean API. As an example, to create a 3 node DigitalOcean Kubernetes cluster made up of Basic Droplets in the SFO2 region, you can use the following doctl command. You need to authenticate with doctl with your API access token and replace the $CLUSTER_NAME variable with the chosen name for your cluster in the command below.
doctl kubernetes clusters create --size s-4vcpu-8gb $CLUSTER_NAME --1-clicks metrics-serverGetting Started After Deploying Kubernetes Metrics Server
Connecting to Your Cluster
You can connect to your DigitalOcean Kubernetes cluster by following our how-to guide.
For additional instructions on configuring a DigitalOcean Kubernetes cluster, see the following guides:
- How to Set Up a DigitalOcean Managed Kubernetes Cluster (DOKS)
- How to Set up DigitalOcean Container Registry
Verifying that Metrics-Server is Running
First, verify that the metrics-server Helm installation was successful by running following command:
helm ls -n metrics-serverIf the installation was successful, the STATUS column value in the output reads deployed:
NAME            NAMESPACE       REVISION        UPDATED                                 STATUS          CHART                   APP VERSION
metrics-server  metrics-server  1               2022-03-16 15:10:59.586786 +0200 EET    deployed        metrics-server-3.11.0    0.6.4
Next, verify that the metrics-server pods are up and running with the following command:
kubectl get pods -n metrics-serverIf they’re running, all pods listed in the output are in a READY state and the STATUS for each reads Running:
NAME                              READY   STATUS    RESTARTS   AGE
metrics-server-694d47d564-mzq2c   1/1     Running   0          75s
metrics-server-694d47d564-pl7v7   1/1     Running   0          75s
Tweaking Helm Chart Values
The metrics-server has custom default Helm values. See the values file from the main GitHub repository (explanations are provided inside, where necessary).
To inspect its current values, run the following command:
helm show values metrics-server/metrics-server --version 3.11.0To change these values, open the Helm values file values.yml, change whatever values you want, save and exit the file, and apply the changes by running helm upgrade command:
helm upgrade metrics-server metrics-server/metrics-server --version 3.11.0 \
  --namespace metrics-server \
  --values values.yml
Checking Available Metrics
The quickest way to test metrics data is via the kubectl top subcommand. You can check resource usage at cluster level (worker nodes), or at pods level.
To check resource usage at cluster level (worker nodes), run below command:
kubectl top nodesThe output looks similar to (notice the resource usage being displayed for both CPU and memory on each worker node):
NAME                   CPU(cores)   CPU%   MEMORY(bytes)   MEMORY%
basicnp-uidj6          50m          5%     1183Mi          75%
basicnp-uidjt          75m          8%     1180Mi          75%
pool-ocas657r9-u0h5m   1619m        85%    2358Mi          75%
pool-ocas657r9-u0h5q   147m         7%     2322Mi          74%
You can also check resource usage at Pod level for a specific namespace, like this:
kubectl top pods -n metrics-serverThe output looks similar to (notice CPU usage expressed in millicores, as well as memory usage in Mebibytes):
NAME                              CPU(cores)   MEMORY(bytes)
metrics-server-694d47d564-mzq2c   4m           24Mi
metrics-server-694d47d564-pl7v7   4m           25Mi
Upgrading Metrics-Server Stack
You can check what versions are available to upgrade by navigating to the metrics-server official releases page from GitHub. Alternatively, you can use ArtifactHUB.
To upgrade the stack to a newer version, run the following command, replacing the < > placeholders with their corresponding information:
helm upgrade metrics-server metrics-server/metrics-server \
  --version <METRICS_SERVER_NEW_VERSION> \
  --namespace metrics-server \
  --values <YOUR_HELM_VALUES_FILE>
See helm upgrade for command documentation.
Also, make sure to check the compatibility matrix, which shows what metrics-server API version is supported by what Kubernetes version.
Uninstalling Metrics-Server Stack
To delete your installation of metrics-server, run the following Helm command:
helm uninstall metrics-server -n metrics-serverNote:
The above command will delete all the associated Kubernetes resources installed by the metrics-server Helm chart, except the namespace itself. To delete the metrics-server namespace as well, run following command:
kubectl delete ns metrics-server