How to View Metrics for Gradient Deployments
Last verified 22 Jan 2026
Paperspace Deployments are containers-as-a-service that allow you to run container images and serve machine learning models using a high-performance, low-latency service with a RESTful API.
Gradient can record Gradient Deployment metrics that are available either in real time or after the workload is complete. You can view Gradient Deployment metrics in the Paperspace console, but you cannot query these metrics using the Paperspace CLI.
Gradient logs three different kinds of metrics: hardware metrics, framework metrics, and custom user metrics. For Gradient Deployments, Gradient monitors and tracks CPU usage, RAM usage, and requests issued.
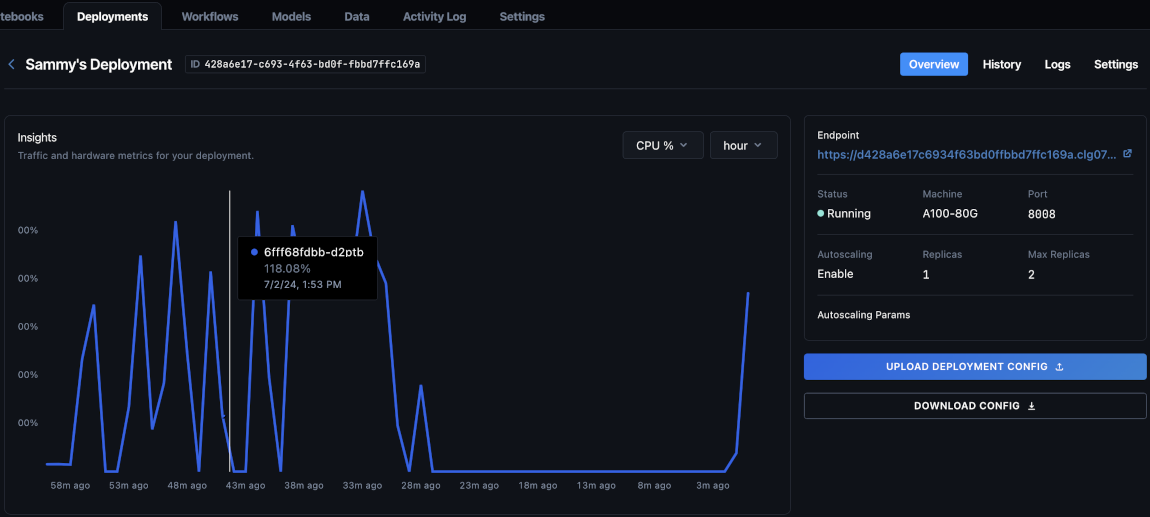
In the Paperspace console, in the top-left corner, click the drop-down menu, then click GRADIENT. In the Projects section, select the project with the Gradient Deployment you want to view. Within your project, click the Deployments tab, then select the Gradient Deployment you want to see metrics for. In the Gradient Deployment’s page, in the top-right corner, click the Overview tab. In the Overview section’s Insights sub-section, view your Gradient Deployment metrics.