Droplet Metrics
Validated on 1 May 2026 • Last edited on 12 May 2026
DigitalOcean Monitoring is a free, opt-in service that helps you track Droplet resource usage, view performance metrics, and receive alerts. The DigitalOcean metrics agent is an open-source Go utility that collects and sends system metrics to DigitalOcean to enable features such as usage graphs, alerts, and custom metrics.
DigitalOcean Monitoring tracks your Droplet’s resource usage over time, including CPU, memory, disk I/O, and GPU metrics such as utilization, throttling, power, and ECC errors. You can use it to understand performance trends, troubleshoot issues, and review real-time or historical data.
To use Monitoring, install the metrics agent on your Droplet. The metrics agent collects system metrics and sends them to the DigitalOcean Control Panel, where you can view graphs and set up alerts with custom thresholds.
Compute
Compute metric graphs help you monitor how efficiently your Droplet uses CPU resources and how much processing demand your workloads place on the system. These metrics help you identify CPU overload, sustained load, and workloads that may need more vCPUs.
Compare load average with the number of vCPUs to see whether your Droplet has enough CPU capacity for its workload. If load average stays above the vCPU count for an extended period, the Droplet may be under sustained CPU pressure. Use the 15-minute load average to identify ongoing contention, while brief spikes in the 1- and 5-minute averages usually reflect short-lived activity.
CPU Utilization
CPU utilization measures the percentage of total processing power the Droplet is using. Alert policies track total CPU usage and don’t distinguish between system time and user time.
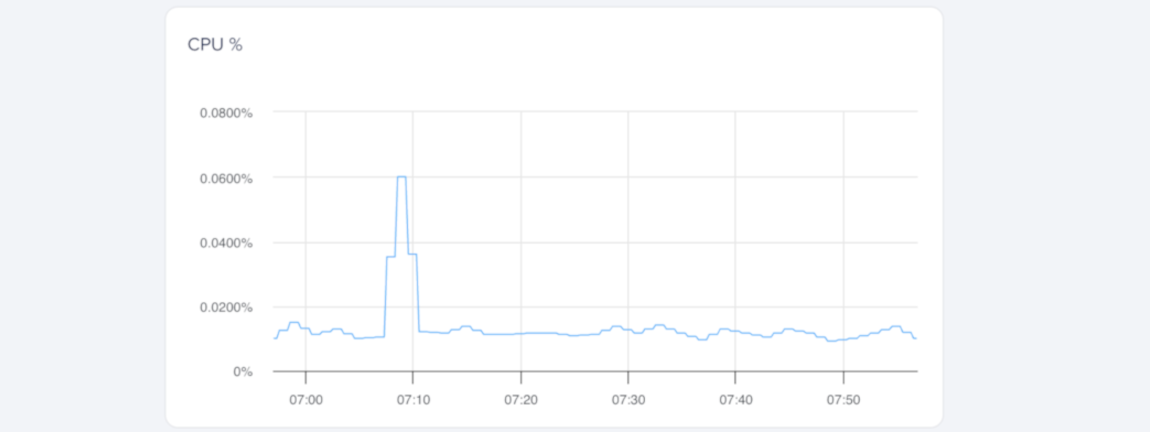
We represent total usage across all CPUs as 100%. Some tools report 100% per CPU core, so a system with two cores may show 200%, and a system with four cores may show 400%.
You can create alert policies for total CPU utilization to detect sustained high CPU usage or sudden spikes that may affect performance.
Load Average
Load average shows how many processes are using or waiting to use the CPU over time, but it doesn’t account for how many vCPUs a Droplet has. For example, a load average of two on a single-vCPU Droplet means one process uses the CPU and another waits, so the Droplet is over capacity. On a Droplet with four vCPUs, the same load uses only half of the available CPU capacity.
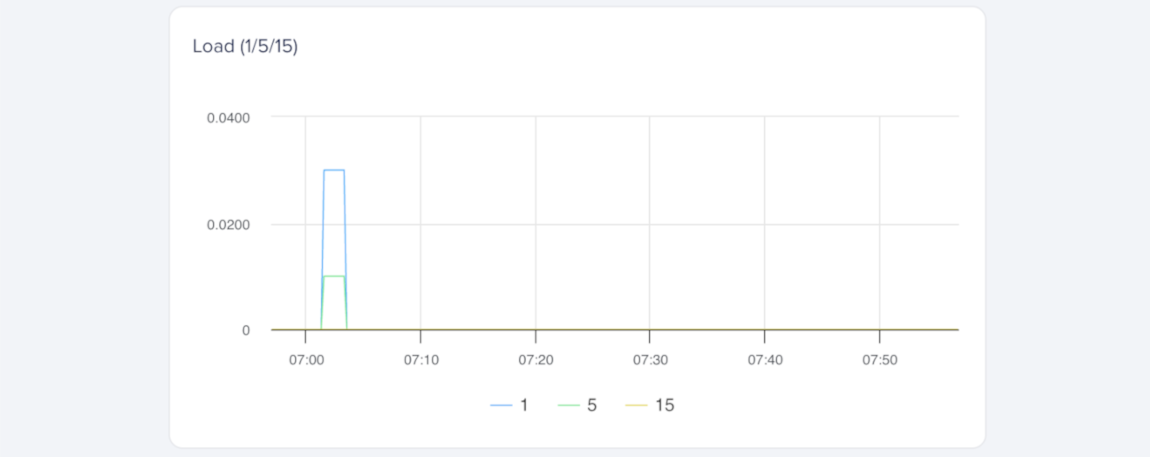
The metrics agent reports 1-, 5-, and 15-minute load averages using data from /proc/loadavg, which tracks processes that are running or waiting for CPU time during those intervals.
You can create alert policies for the 1-minute, 5-minute, or 15-minute load averages, depending on whether you want to detect brief spikes, moderate pressure, or sustained CPU contention.
Memory
Memory utilization shows the percentage of physical memory in use. We calculate it from /proc/meminfo, which provides detailed information about total, free, and cached memory.
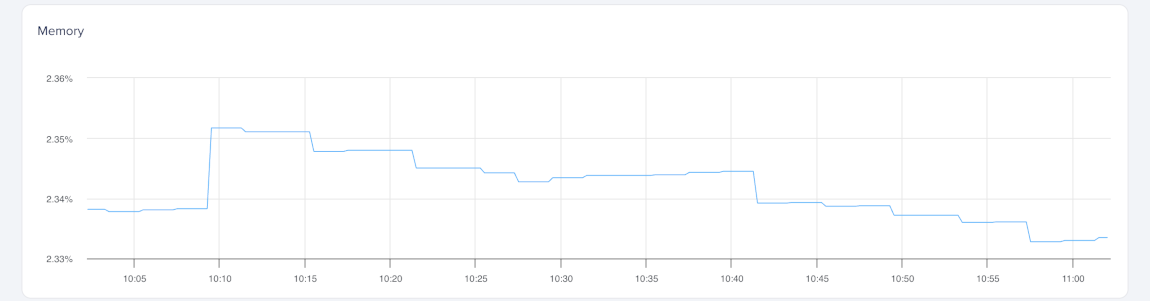
We calculate used memory by subtracting free and cached memory from total memory. Linux uses unused memory for disk caching to improve performance, but frees that memory when processes need it. Because cached memory is effectively available, we don’t count it as used. As a result, tools such as htop and top may show higher usage because they count cached memory as used.
You can create alert policies for memory utilization to detect sustained memory pressure or unexpected increases in memory usage.
Storage
Storage metric graphs help you monitor how much disk space your Droplet is using and how much read and write activity reaches its disks. These metrics help you identify storage bottlenecks, capacity limits, and workloads that generate heavy disk activity.
Compare disk utilization with disk I/O to understand whether the issue is capacity or activity. Rising disk utilization shows that the Droplet is running out of storage space, while high disk I/O shows that the workload is reading from or writing to disk heavily. A Droplet can have high disk activity without being close to full, or it can be nearly full with little ongoing I/O.
Disk I/O
Disk I/O measures how much data the Droplet reads from and writes to its disks. High disk I/O can indicate performance issues caused by intensive read or write operations.
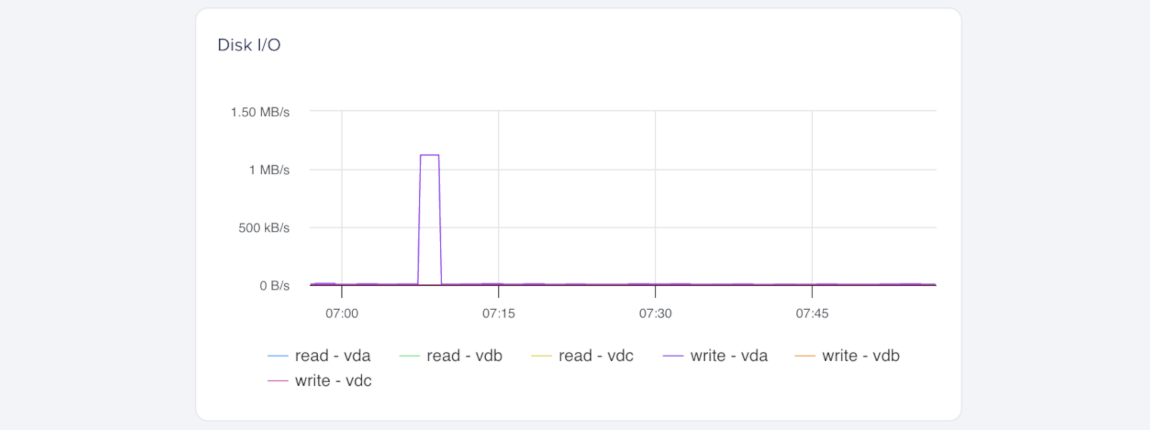
You can create alert policies for read activity and write activity to detect spikes or bottlenecks.
Disk Utilization
Disk utilization shows the percentage of the Droplet’s root disk that is in use. It doesn’t include attached block storage volumes. Each attached volume is monitored separately and doesn’t contribute to the Droplet’s disk utilization metric.
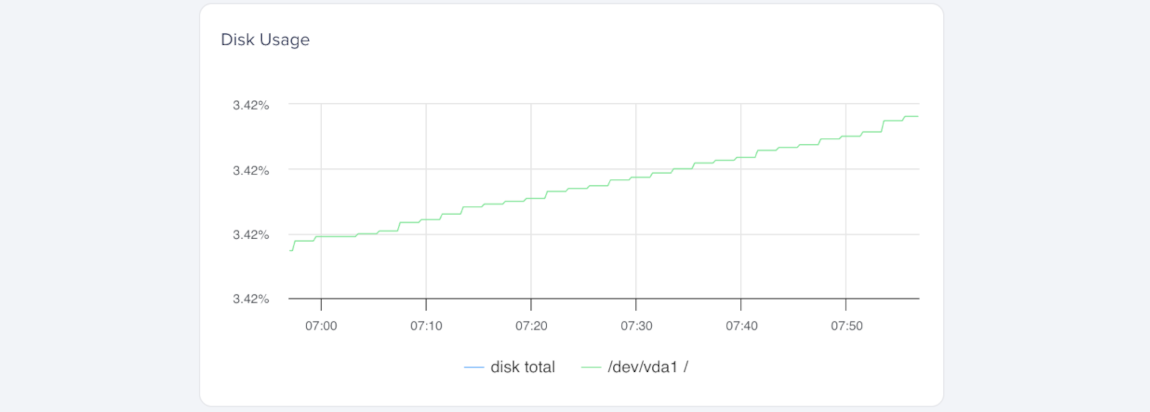
You can create alert policies for disk utilization to detect low available disk space. Alert policies also use this total when monitoring disk space.
Network
Network metric graphs help you monitor traffic flowing into and out of your Droplet. These metrics help you identify heavy network activity, distinguish between public and private traffic, and detect unusual bandwidth patterns that may affect performance or connectivity.
Compare public and private bandwidth, and compare inbound and outbound traffic, to understand where network activity is happening. Higher public traffic usually reflects internet requests or external transfers, while higher private traffic usually reflects communication between Droplets in the same datacenter. Differences between inbound and outbound traffic can also help you tell whether the Droplet primarily receives data, sends data, or does both evenly.
Bandwidth
Bandwidth measures the amount of incoming and outgoing network traffic on a Droplet. High usage may indicate heavy network activity or unusual traffic patterns.
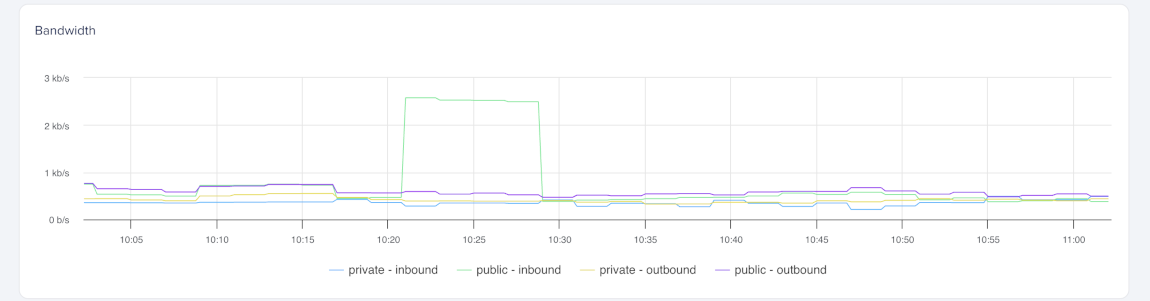
These graphs split bandwidth into public and private traffic. Public bandwidth measures traffic sent and received through the Droplet’s public network interface. Private bandwidth measures traffic between your Droplets in the same datacenter. Each graph includes separate lines for inbound and outbound traffic.
You can create alert policies for public inbound, public outbound, private inbound, and private outbound bandwidth, depending on which type of network traffic you want to monitor.