How to View Agent Insights and Logs on DigitalOcean Gradient™ AI Platform
Validated on 5 Feb 2026 • Last edited on 5 Feb 2026
DigitalOcean Gradient™ AI Platform lets you build fully-managed AI agents with knowledge bases for retrieval-augmented generation, multi-agent routing, guardrails, and more, or use serverless inference to make direct requests to popular foundation models.
You can view performance insights and runtime logs for your agents to help you troubleshoot issues and understand how your agents are performing.
View Agent Metrics
The Agent Metrics feature shows your agent’s token usage, traffic, and performance in real time. Use it to monitor efficiency, troubleshoot issues, and adjust your agent’s configuration as needed. Data may be delayed by up to 15 minutes.
To view metrics for an agent from the DigitalOcean Control Panel, click Agent Platform in the left menu. In the Agent workspaces tab, select the workspace that contains the agent you want to inspect. In the Agents tab, select the agent.
In the agent’s Overview page, go to the Agent Metrics section. Here, you can:
-
View a line graph of token usage over time. Use the dropdown menu to choose one of the following:
- Tokens In: Input tokens sent by users.
- Tokens Out: Output tokens generated by the agent.
- Total Tokens: All tokens combined.
- Requests In: The number of user requests received.
You can also select the time range (for example, last 1 hour, last 14 days) to analyze short-term spikes or longer-term trends.
-
Review Token Metrics, which provide the following performance details:
- Average end-to-end throughput: The average number of tokens processed per second.
- Average end-to-end latency: The average time it takes to deliver a complete response.
- Average time to first token: The average time before the agent begins streaming the first token.
View Agent Runtime Logs
Viewing agent runtime logs can help you understand how your agent is performing and troubleshoot issues. Runtime logs show the events that occur while your agent processes a prompt, such as which knowledge bases and functions were accessed to generate a response.
To view the runtime logs for an agent, go to the DigitalOcean Control Panel and click Agent Platform in the left menu. In the Agent workspaces tab, select the workspace that contains the agent you want to view logs for and select the agent.
In the agent’s Observability tab, under the Runtime Logs section, you can view the agent runtime logs in real time.
View Conversation Logs, Traces, and Insights
Traces, insights, and conversation logs work together to help you monitor agent behavior, troubleshoot issues, and improve performance. They give you visibility into how prompts are processed, how responses are generated, and how users interact with your agent:
- Traces: Provide a step-by-step timeline of each prompt with token usage, processing time, and resource access. If you enable trace storage, traces also include full inputs and outputs, giving you a detailed record of the conversation flow.
- Insights: Build on trace data by analyzing it with a third-party model to suggest improvements. They highlight ways to reduce latency, optimize token usage, and refine agent behavior for better results.
- Conversation logs: Capture every input and output across channels such as playground sessions and API calls. Reviewing these logs helps you see how the agent performs in real interactions and understand the user experience.
Conversation logs and traces are enabled by default on agent responses. To enable log stream insights, navigate to the control panel and click Agent Platform in the left menu. In the Workspaces tab, select the workspace that contains the agent and select the agent. In the agent’s Observability tab, go to the Traces and conversation logs section and toggle the Log stream insights option to on. By enabling insights, you consent to sending trace data to a third-party model. Insights incur additional costs. For details, see our pricing page.
To view traces and insights, in the View your traces and conversation log stream section, click View log stream. The log stream opens in a new window where you can inspect sessions and prompt traces:
To view conversation logs, in the Sessions tab, select a session to open the Messages screen and see the full conversation.
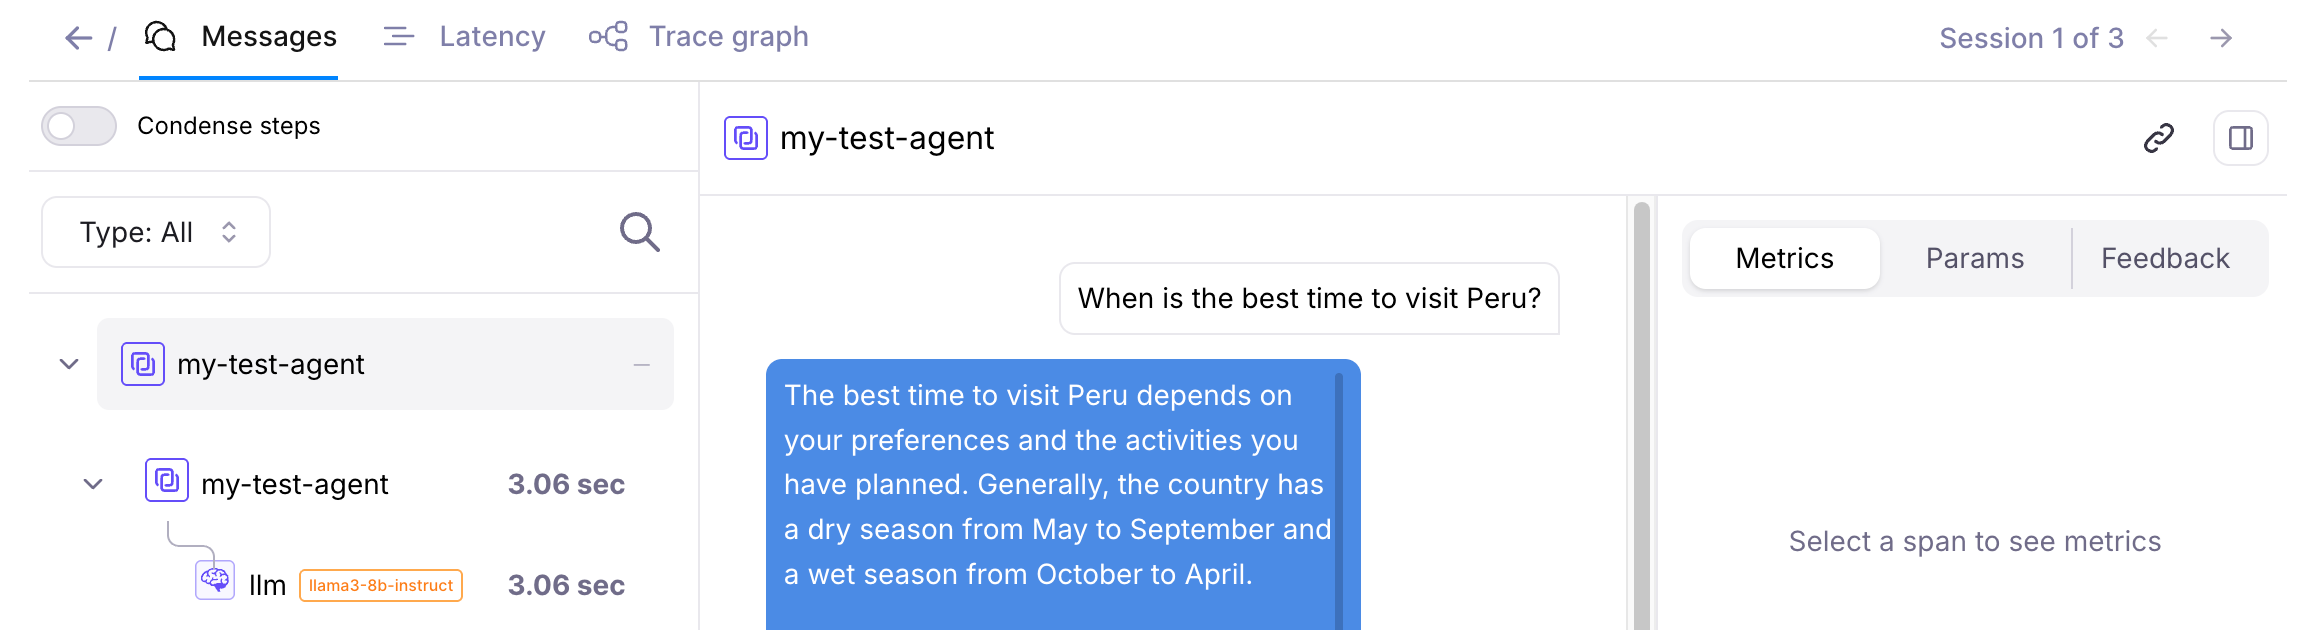
To view traces, go to the Traces tab and click on a response to see a step-by-step timeline of each prompt with token usage, processing time, resource access, and conversation flow. In the right panel, review the following for each response:
-
In the Metrics and Parameters tabs, see detailed metrics and parameters.
-
In the Feedback tab, view the thumb rating and feedback your end users provide through the chatbot interface or you provide when testing an agent in the agent playground.
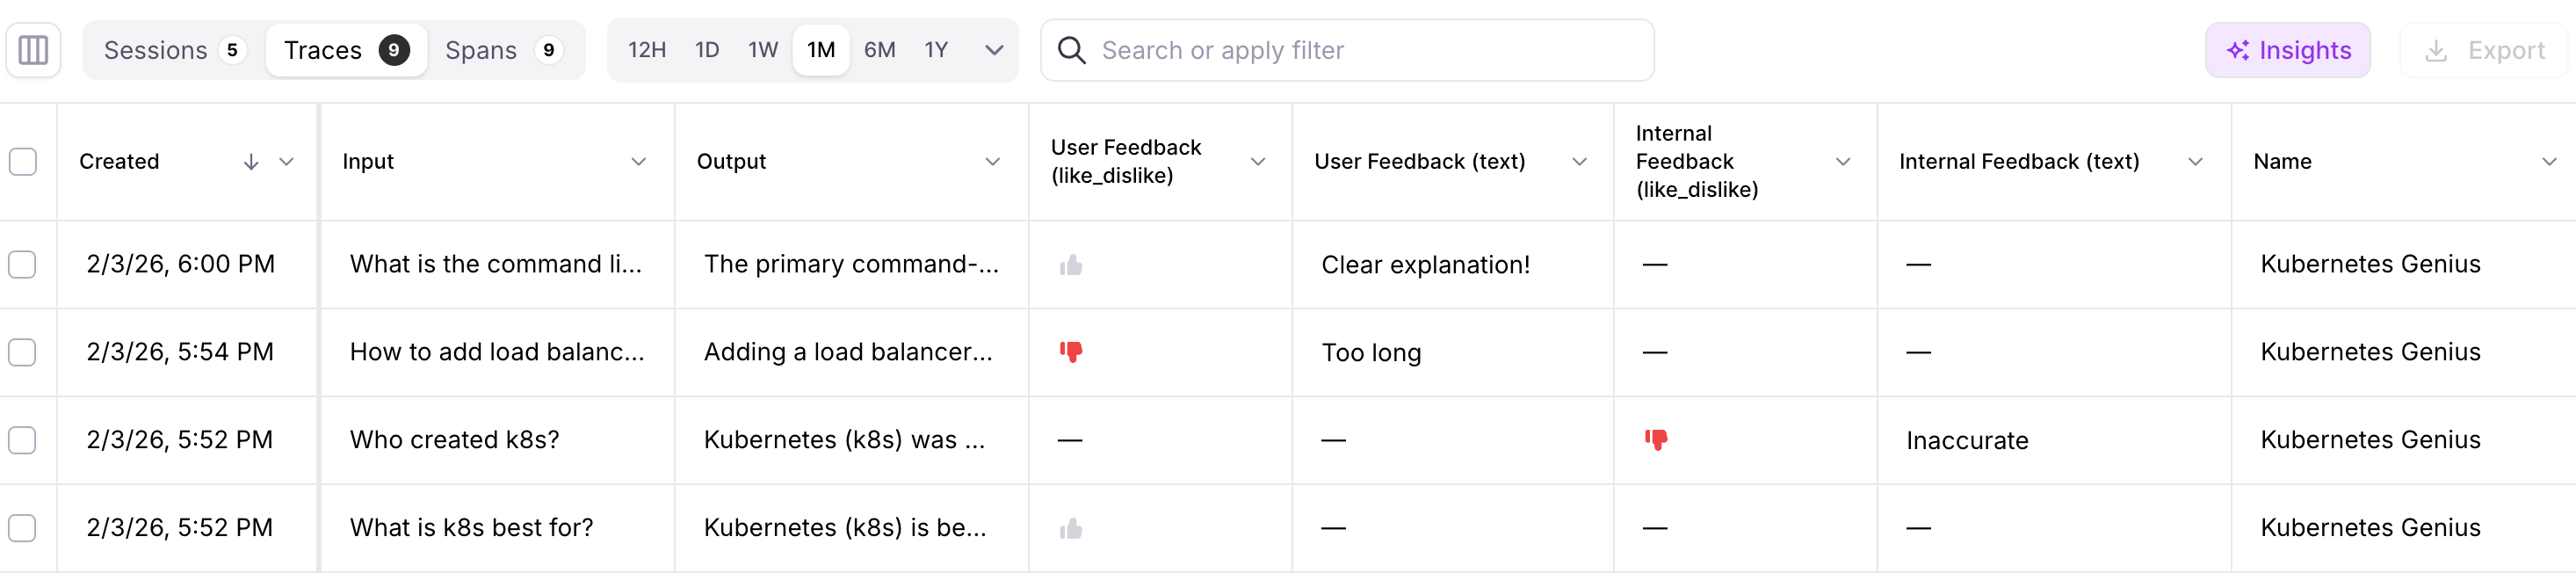
The user-provided thumb rating and reason appear in the User Feedback columns of the trace details while internal feedback through agent playground appears in the Internal Feedback columns. You can add or remove columns, or reorder the columns by clicking the icon to the left of the Sessions tab and making the changes in the window that opens.
You can also directly add an internal rating (thumb rating and rating reason) to a response or modify internal feedback in the log stream trace. Click a trace to open the trace details, then go to the Feedback tab in the right panel, and give feedback for that agent response.

For more about traces, see the Agent Tracing Data reference.
To access insights, on the top right of the page in the log stream window, click Insights. If you already have insights, use the Refresh insights menu to regenerate them. Insights may not generate if no new data is available since the last run.
You can see the insights in the Insights tab in the right panel of the agent’s Traces tab.
Disable Insights
To disable insights at any time, in the control panel, click Agent Platform in the left menu. In the Workspaces tab, select the workspace that contains the agent you want to disable insights for. Select the agent, and then click the Settings tab. In the Log Stream Insights section, click Edit. To stop storing log stream insights, click Disable log stream insights to open the Disable log stream insights window. To confirm, type your agent’s name, and then click Disable log stream insights.
Disabling insights stops the collection of new insights and does not stop trace storage or delete existing insights.