How to Trace Agent Responses on DigitalOcean Gradient™ AI Platform
Validated on 6 Feb 2026 • Last edited on 11 Feb 2026
DigitalOcean Gradient™ AI Platform lets you build fully-managed AI agents with knowledge bases for retrieval-augmented generation, multi-agent routing, guardrails, and more, or use serverless inference to make direct requests to popular foundation models.
Agent Tracing shows a step-by-step timeline of how your agent processes each prompt, from receiving the input to generating the final response. Each trace includes: token usage, processing times, session and trace IDs, and accessed resources such as knowledge bases, agent routing, and functions. Trace storage is enabled by default for both newly created and existing agents.
View Traces
You can access traces from the agent’s Observability tab. Go to the Traces and conversation logs section and click View log stream to open the log stream window where you can view traces at three levels of granularity:
- Sessions display the complete set of interactions (traces) with your agent, including all prompts and responses within a single session.
- Traces display individual actions (spans) taken during an interaction, including the prompt, response, and all processing steps.
- Spans display information about the individual action taken by the agent, such as a tool call, knowledge base retrieval, or function execution.
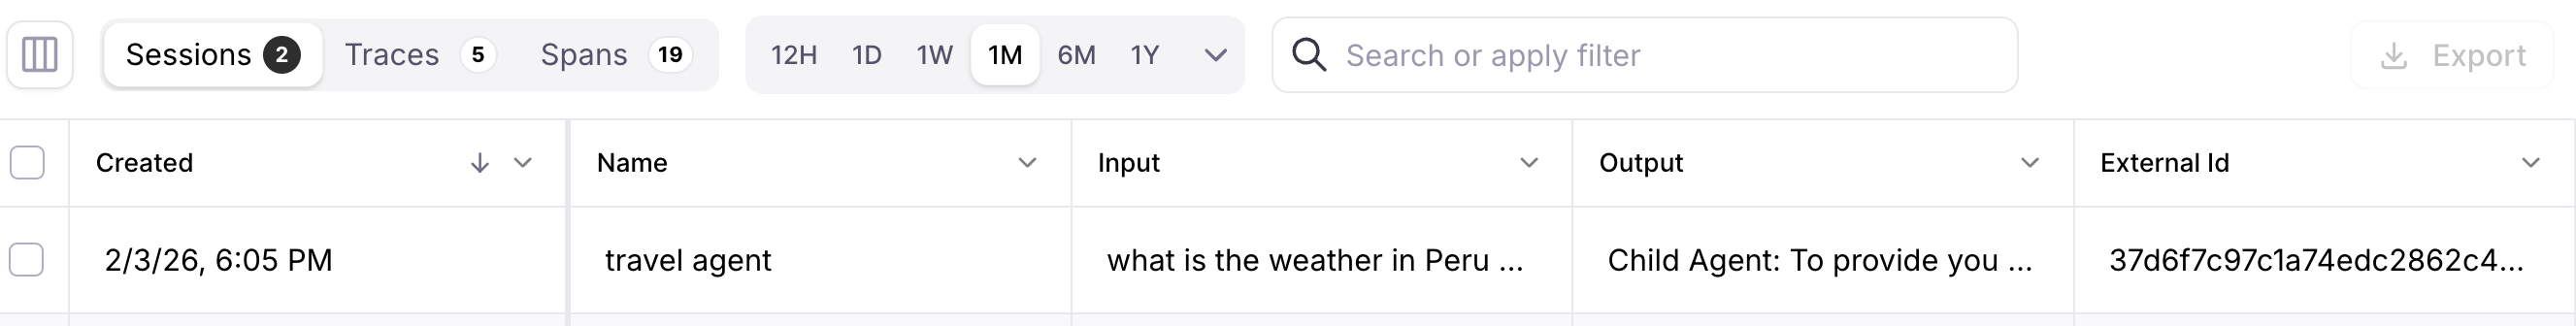
To list traces by individual sessions, traces, or spans, click their respective tabs. The view defaults to Sessions, which lists all sessions for the agent. You can click on the Traces or Spans tab to see more details, including IDs, timestamps, and processing times. This view is useful for quickly scanning through the session’s interactions.
To open a session, in the Sessions tab, click a session from the list. This opens the Messages tab which shows a conversation log and a waterfall chart of all the traces for that session.
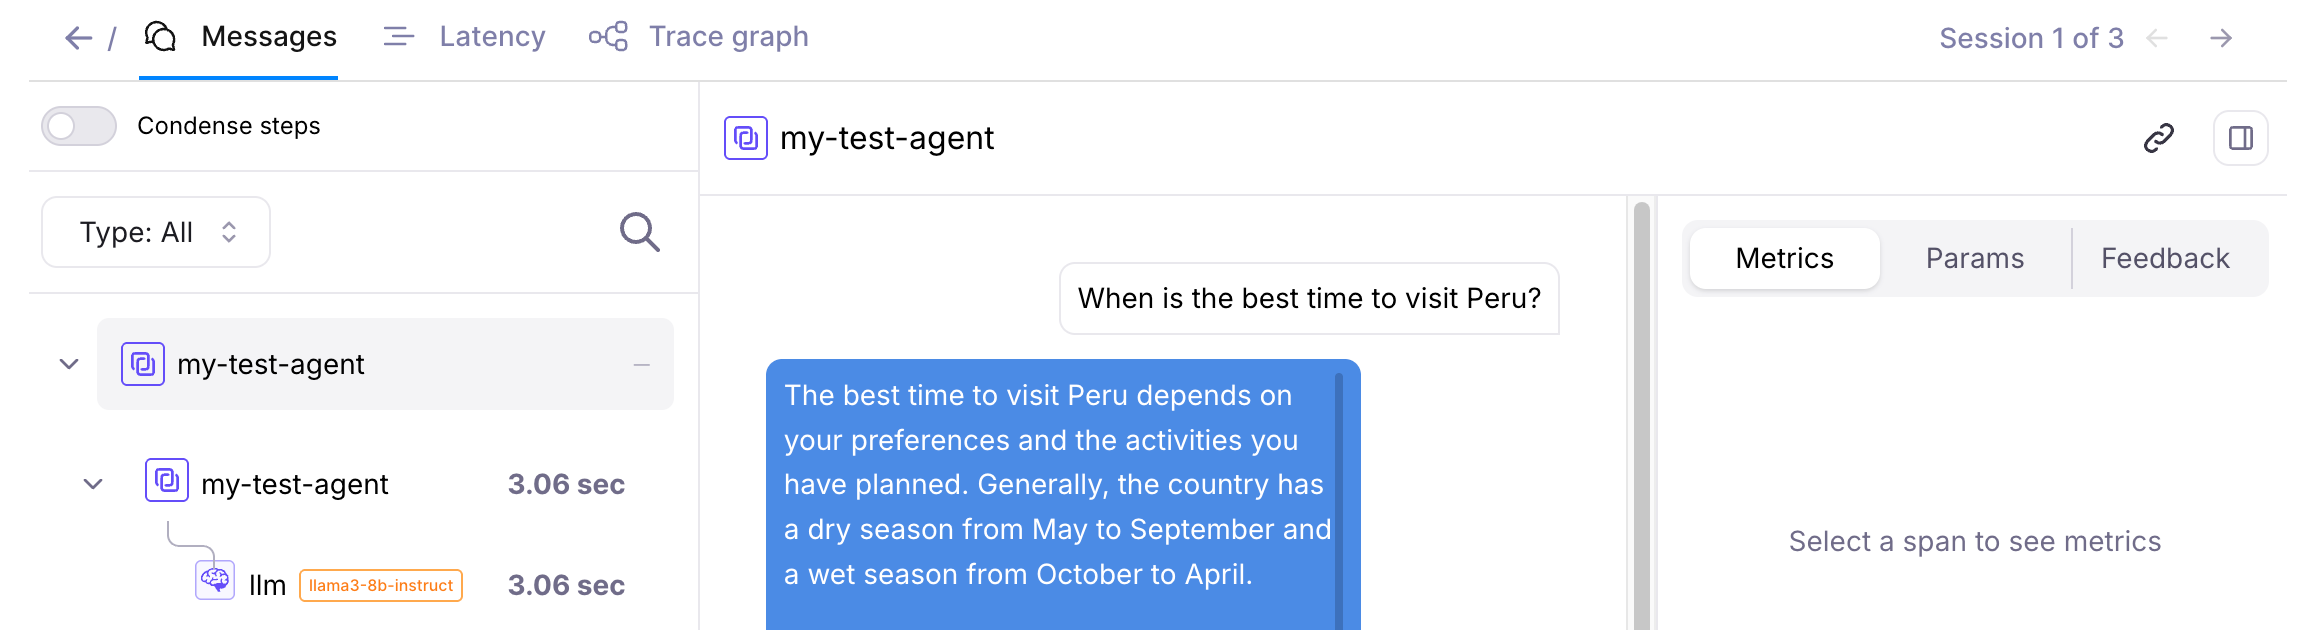
You can click on any of the nodes to see more details about that step in the trace, and then page through the session by clicking the left and right arrows at the top of the diagram.
Latency Views
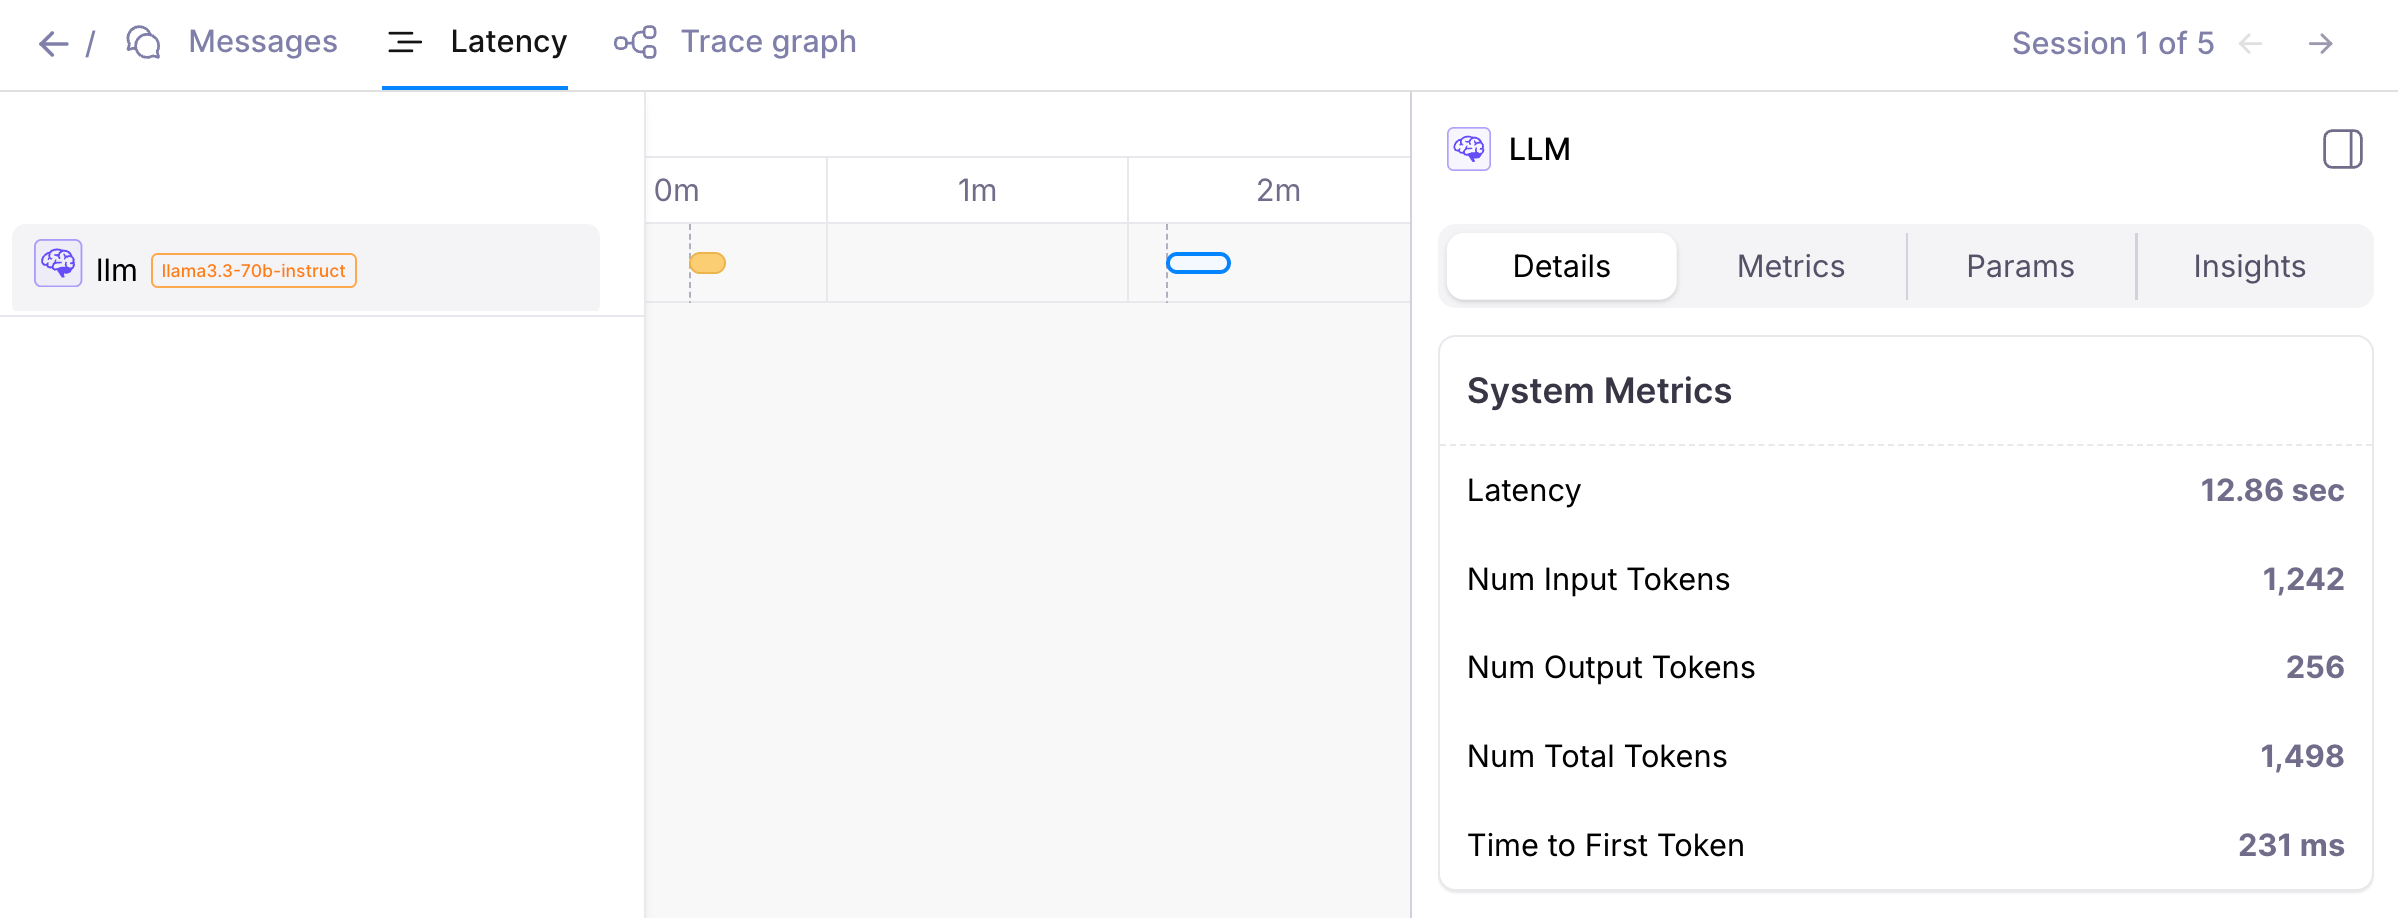
The Latency tab provides additional insights into the agent’s performance.
To view the latency for each step in the session, click the Latency tab. This shows a timeline of the session’s processing times. You can click on individual nodes in the timeline to see more details about that step. This can help you identify bottlenecks or delays in the agent’s processing.
Export Traces
Exporting session and tracing logs lets you download session or trace data as a .csv file for offline analysis or archiving.
To begin exporting data, go to the DigitalOcean Control Panel, in the left menu, click Agent Platform, then in Agent Workspaces, select the workspace that contains your agent. From the workspace’s Agents tab, select the agent, then click the Observability tab and scroll to the Traces and conversation logs section.
In the log stream window, switch to either the Sessions or Traces tab, select the interactions you want to export using the checkboxes, then click Export to open the Export Data window.
In the export window, choose the columns you want to include. You can click All, None, or Visible Columns (the default set), or manually select individual columns using the checkboxes.
After selecting your columns, choose a file name or leave the field blank to use the autogenerated name. Then, click Export to download the .csv file to your local machine.