Connection Status Metric
Connection status metric is a metric that measures the number of threads created, connected, and running in relation to a database’s connection limit.
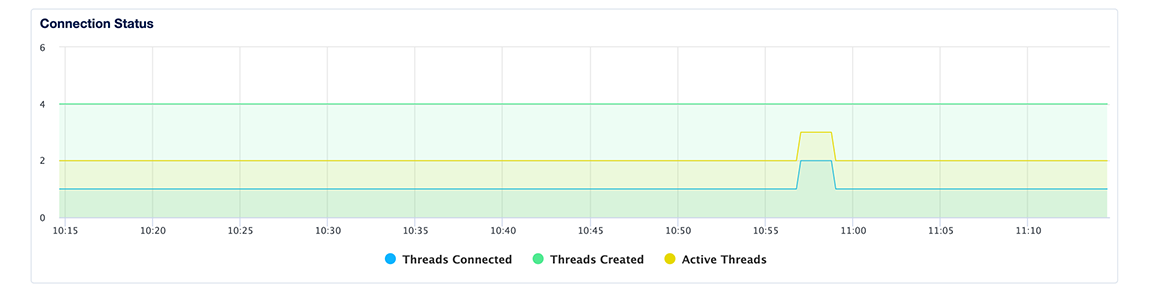
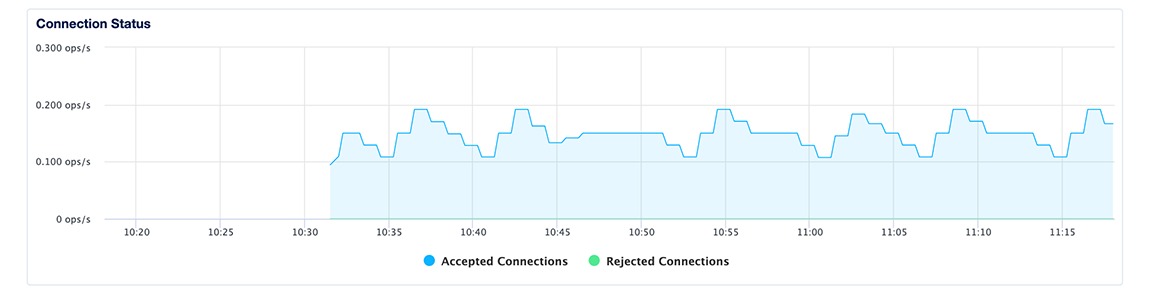
The connection status metric displays the number of connections received and rejected per second, the number of newly created threads per second, the number of active threads per second, and the total number of threads connected to the database per second.
The connection status plot displays:
- The total number of threads connected to the database per second.
- The number of newly created threads per second.
- The number of active threads connected to the database per second.
If the number of connected threads regularly approaches or exceeds the connection limit, or if you often see an unacceptable number of rejected connections, consider upgrading your database plan to increase your connection limit.
MySQL
For more information on monitoring MySQL clusters, see How to Monitor MySQL Database Performance.
Redis
For more information on monitoring Redis clusters, see How to Monitor Redis Database Cluster Performance.