
Kubernetes Application Log Monitoring and Retention using Grafana Loki and DigitalOcean Spaces
Kubernetes log monitoring and retention setup is crucial for production workloads as it aids in:
- Troubleshooting and debugging applications and infrastructure.
- Monitoring performance and optimizing resource usage.
- Enhancing security by detecting and responding to threats.
- Providing an audit trail for compliance and historical analysis.
This tutorial will guide you through the process of installing Grafana Loki, an open-source log aggregation system on DigitalOcean Kubernetes. We will configure Loki to use DigitalOcean Spaces, an S3-compatible object storage service, to retain the aggregated logs.
Prerequisites
Before you begin, make sure you have the following prerequisites installed:
- Terraform CLI - v1.5.1 or later
- Helm CLI - version 2.9.10 or later
- kubectl - Kubernetes command-line tool
- Configure s3cmd with DO Spaces
Demo Environment Setup Overview
To streamline the process of setting up the demo environment, we will utilize the k8s-bootstrapper tool, which simplifies the following setup steps.
- Set up a DigitalOcean Kubernetes (DOKS) cluster.
- Create a DigitalOcean Spaces bucket.
- Deploy the sample Emojivoto microservices application.
After the bootstrapping process is complete, we will continue with the following manual steps:
- Install Grafana Loki using Helm.
- Configure Loki to use DigitalOcean Spaces as the storage backend for logs.
By the end of this tutorial, you will have a fully functional Loki Stack integrated with Grafana for log aggregation, visualization, and monitoring, with log retention powered by DigitalOcean Spaces.
Installation Walkthrough
First, we must check out the loki-spaces-demo branch of the k8s-bootstrapper project on GitHub.
Note: It is essential to check out the
loki-spaces-demobranch, as it has all the configurations catered for this demo
git clone -b loki-spaces-demo https://github.com/hivenetes/k8s-bootstrapper.git && cd k8s-bootstrapper
Set up the demo environment
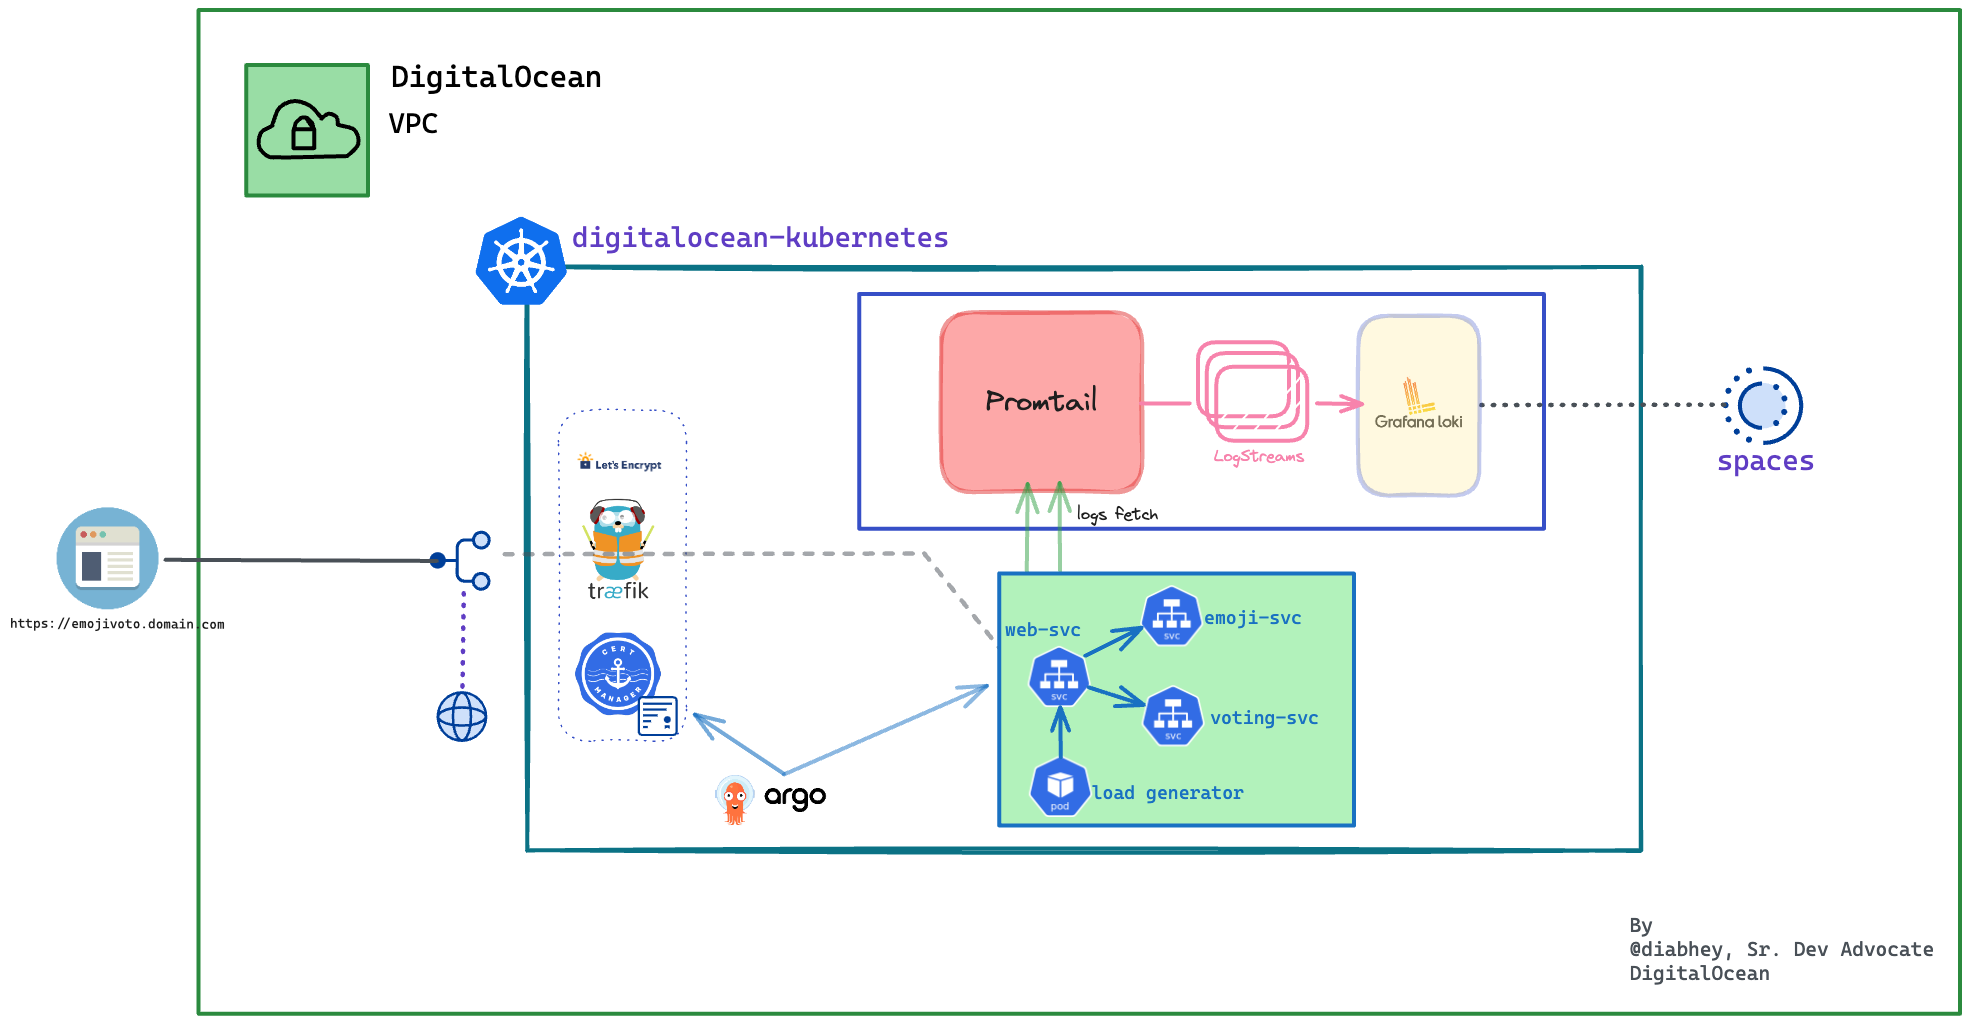
Upon successful installation, you should have a demo environment as seen below:
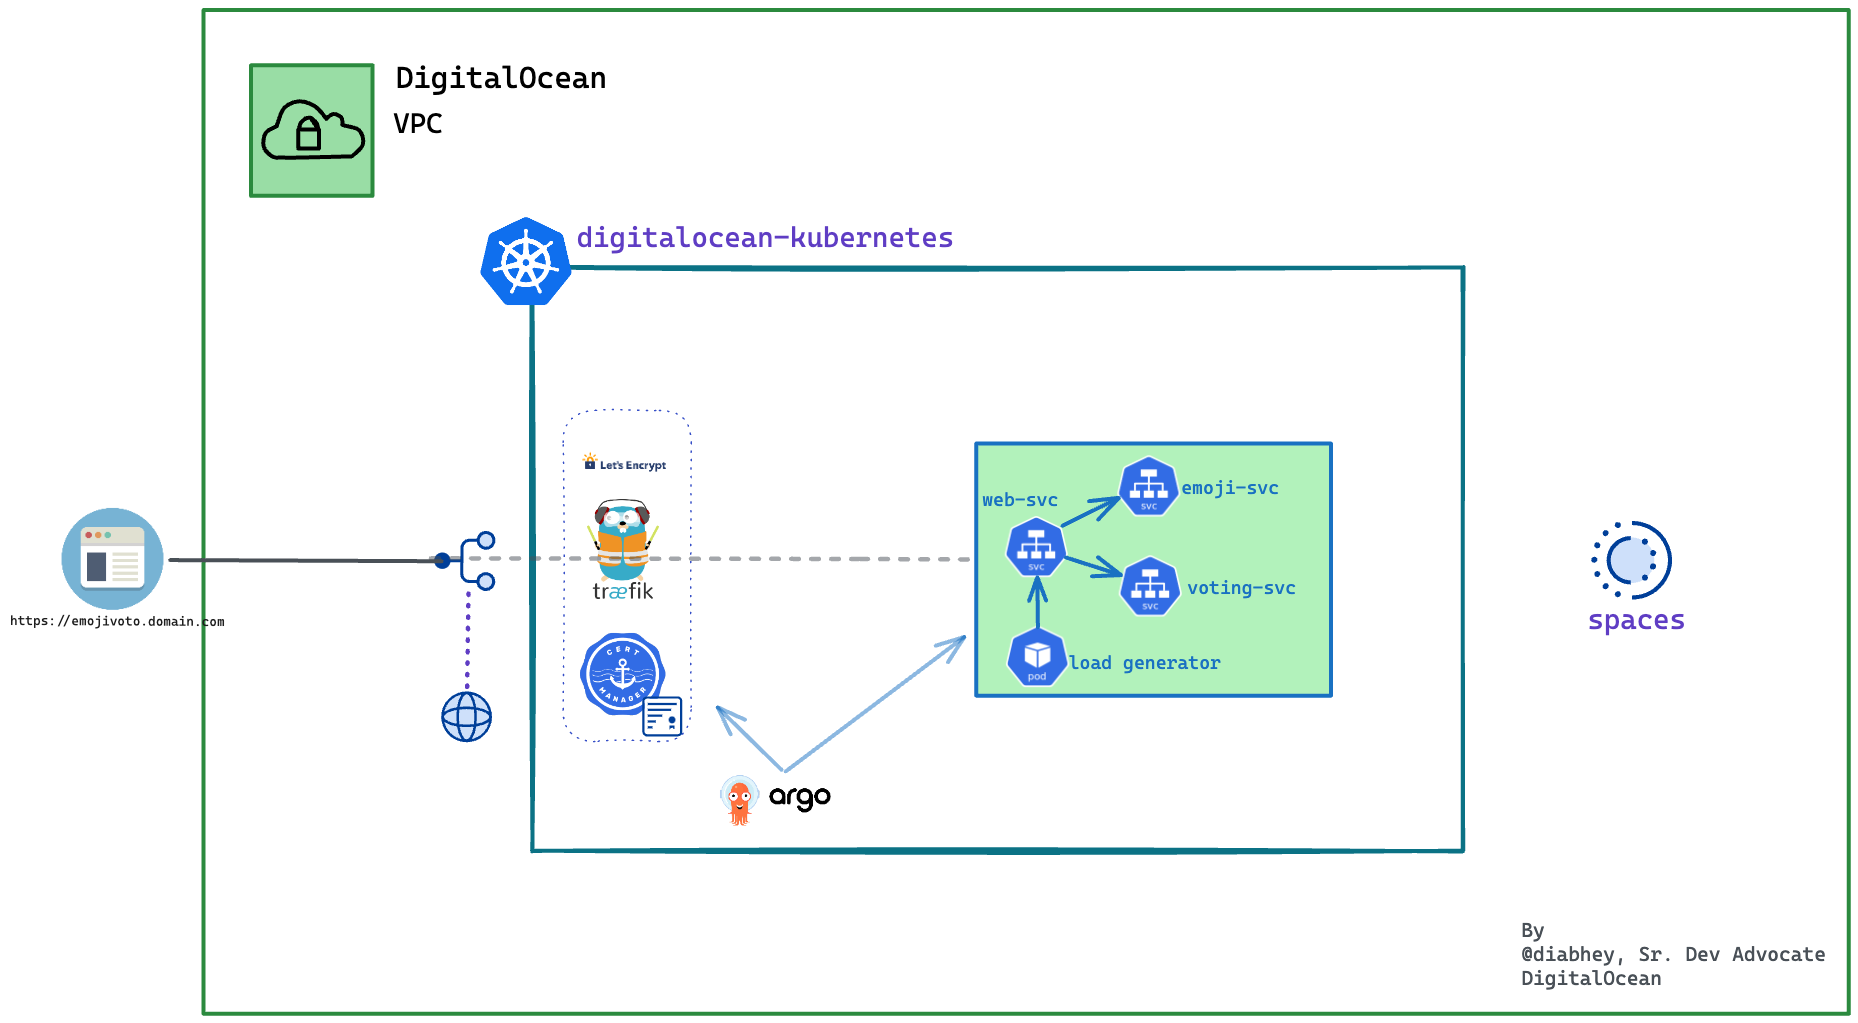
We will now go ahead and manually install the loki-stack.
DigitalOcean Spaces Persistent Storage for Loki
Loki is a horizontally scalable, highly available, multi-tenant log aggregation system inspired by Prometheus. It is designed to be very cost-effective and easy to operate. It does not index the contents of the logs but rather a set of labels for each log stream.
In this step, we will enable persistent storage for Loki and use the DO Spaces bucket to store the application logs. Since we will be installing loki-stack via helm chart-2.9.10, we can override the defaults by modifying the loki-stack-values-2.9.10.yaml.
# loki-stack-values-2.9.10.yaml
# The final `Loki` storage setup configuration looks similar to this (please replace the `<>` placeholders accordingly):
loki:
enabled: true
config:
schema_config:
configs:
- from: "2020-10-24"
store: boltdb-shipper
object_store: aws
schema: v11
index:
prefix: index_
period: 24h
storage_config:
boltdb_shipper:
active_index_directory: /data/loki/boltdb-shipper-active
cache_location: /data/loki/boltdb-shipper-cache
cache_ttl: 24h
shared_store: aws
# !!! DO SPACES CONFIGURATION!!!
aws:
bucketnames: <YOUR_DO_SPACES_BUCKET_NAME_HERE>
endpoint: <YOUR_DO_SPACES_BUCKET_ENDPOINT_HERE> # <region>.digitaloceanspaces.com
region: <YOUR_DO_SPACES_BUCKET_REGION_HERE> # short region name (e.g.: fra1)
access_key_id: <YOUR_DO_SPACES_ACCESS_KEY_HERE>
secret_access_key: <YOURDO_SPACES_SECRET_KEY_HERE>
s3forcepathstyle: true
Note: The DO Spaces configuration should match the bootstrapper spaces config
Install Grafana Loki for Log Aggregation and Monitoring
To install Loki Stack using Helm, we need to add the Grafana Helm Chart repository to Helm.
-
Add the Loki Stack Helm Chart Repository
# Adds the Grafana Helm Chart repository to Helm # This allows us to install Loki Stack from this repository. helm repo add grafana https://grafana.github.io/helm-charts -
Deploy the Loki Stack v2.9.10 Chart
Verify the configurations provided through the loki-stack-values-2.9.10.yaml file. Then run the following command:
HELM_CHART_VERSION="2.9.10"

helm install loki grafana/loki-stack --version "${HELM_CHART_VERSION}" \
--namespace=loki-stack \
--create-namespace \
-f "demo/loki-spaces/assets/manifests/loki-stack-values-${HELM_CHART_VERSION}.yaml"
This command installs the Loki Stack with the specified Helm chart version. It creates a new namespace called “loki-stack” and deploys the Loki Stack components into that namespace.
-
Finally, check the
Helmrelease status:helm ls -n loki-stackThe output looks similar to (
STATUScolumn should display ‘deployed’):NAME NAMESPACE REVISION UPDATED STATUS CHART APP VERSION loki loki-stack 1 2023-06-28 20:49:28.619273 +0200 CEST deployed loki-stack-2.9.10 v2.6.1
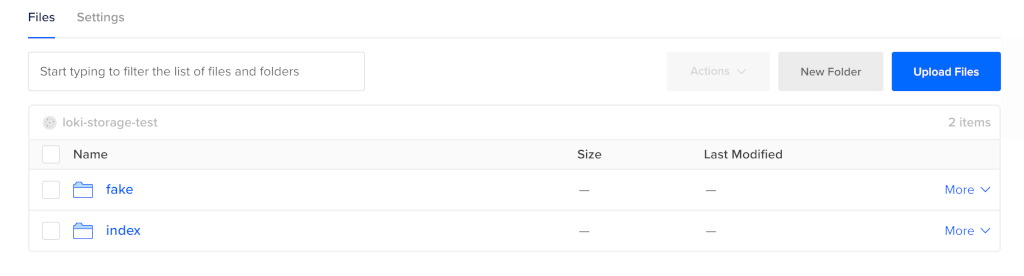
If everything goes well, you should see the DO Spaces bucket containing the index and chunks folders on the DO: Cloud Control Panel.
Monitor logs with Grafana
Let’s access Grafana to monitor the emojivoto application logs.
# Expose the `Grafana` web svc on your local machine.
kubectl --namespace loki-stack port-forward svc/loki-grafana 3000:80
After the installation, you can retrieve the admin password for Grafana.
# This command retrieves the admin password for Grafana from the secret named "loki-grafana" in the "loki-stack" namespace.
# The password is then decoded from Base64 and displayed in the terminal.
kubectl get secret --namespace loki-stack loki-grafana -o jsonpath="{.data.admin-password}" | base64 --decode ; echo
Next, open a web browser on localhost:3000:
- Log in using username:
adminand the password:from the previous step. - Click the
Exploreicon from the left panel to access the application logs
Access Grafana Dashboards
Next, point your web browser to localhost:3000, and navigate to the Explore tab from the left panel.
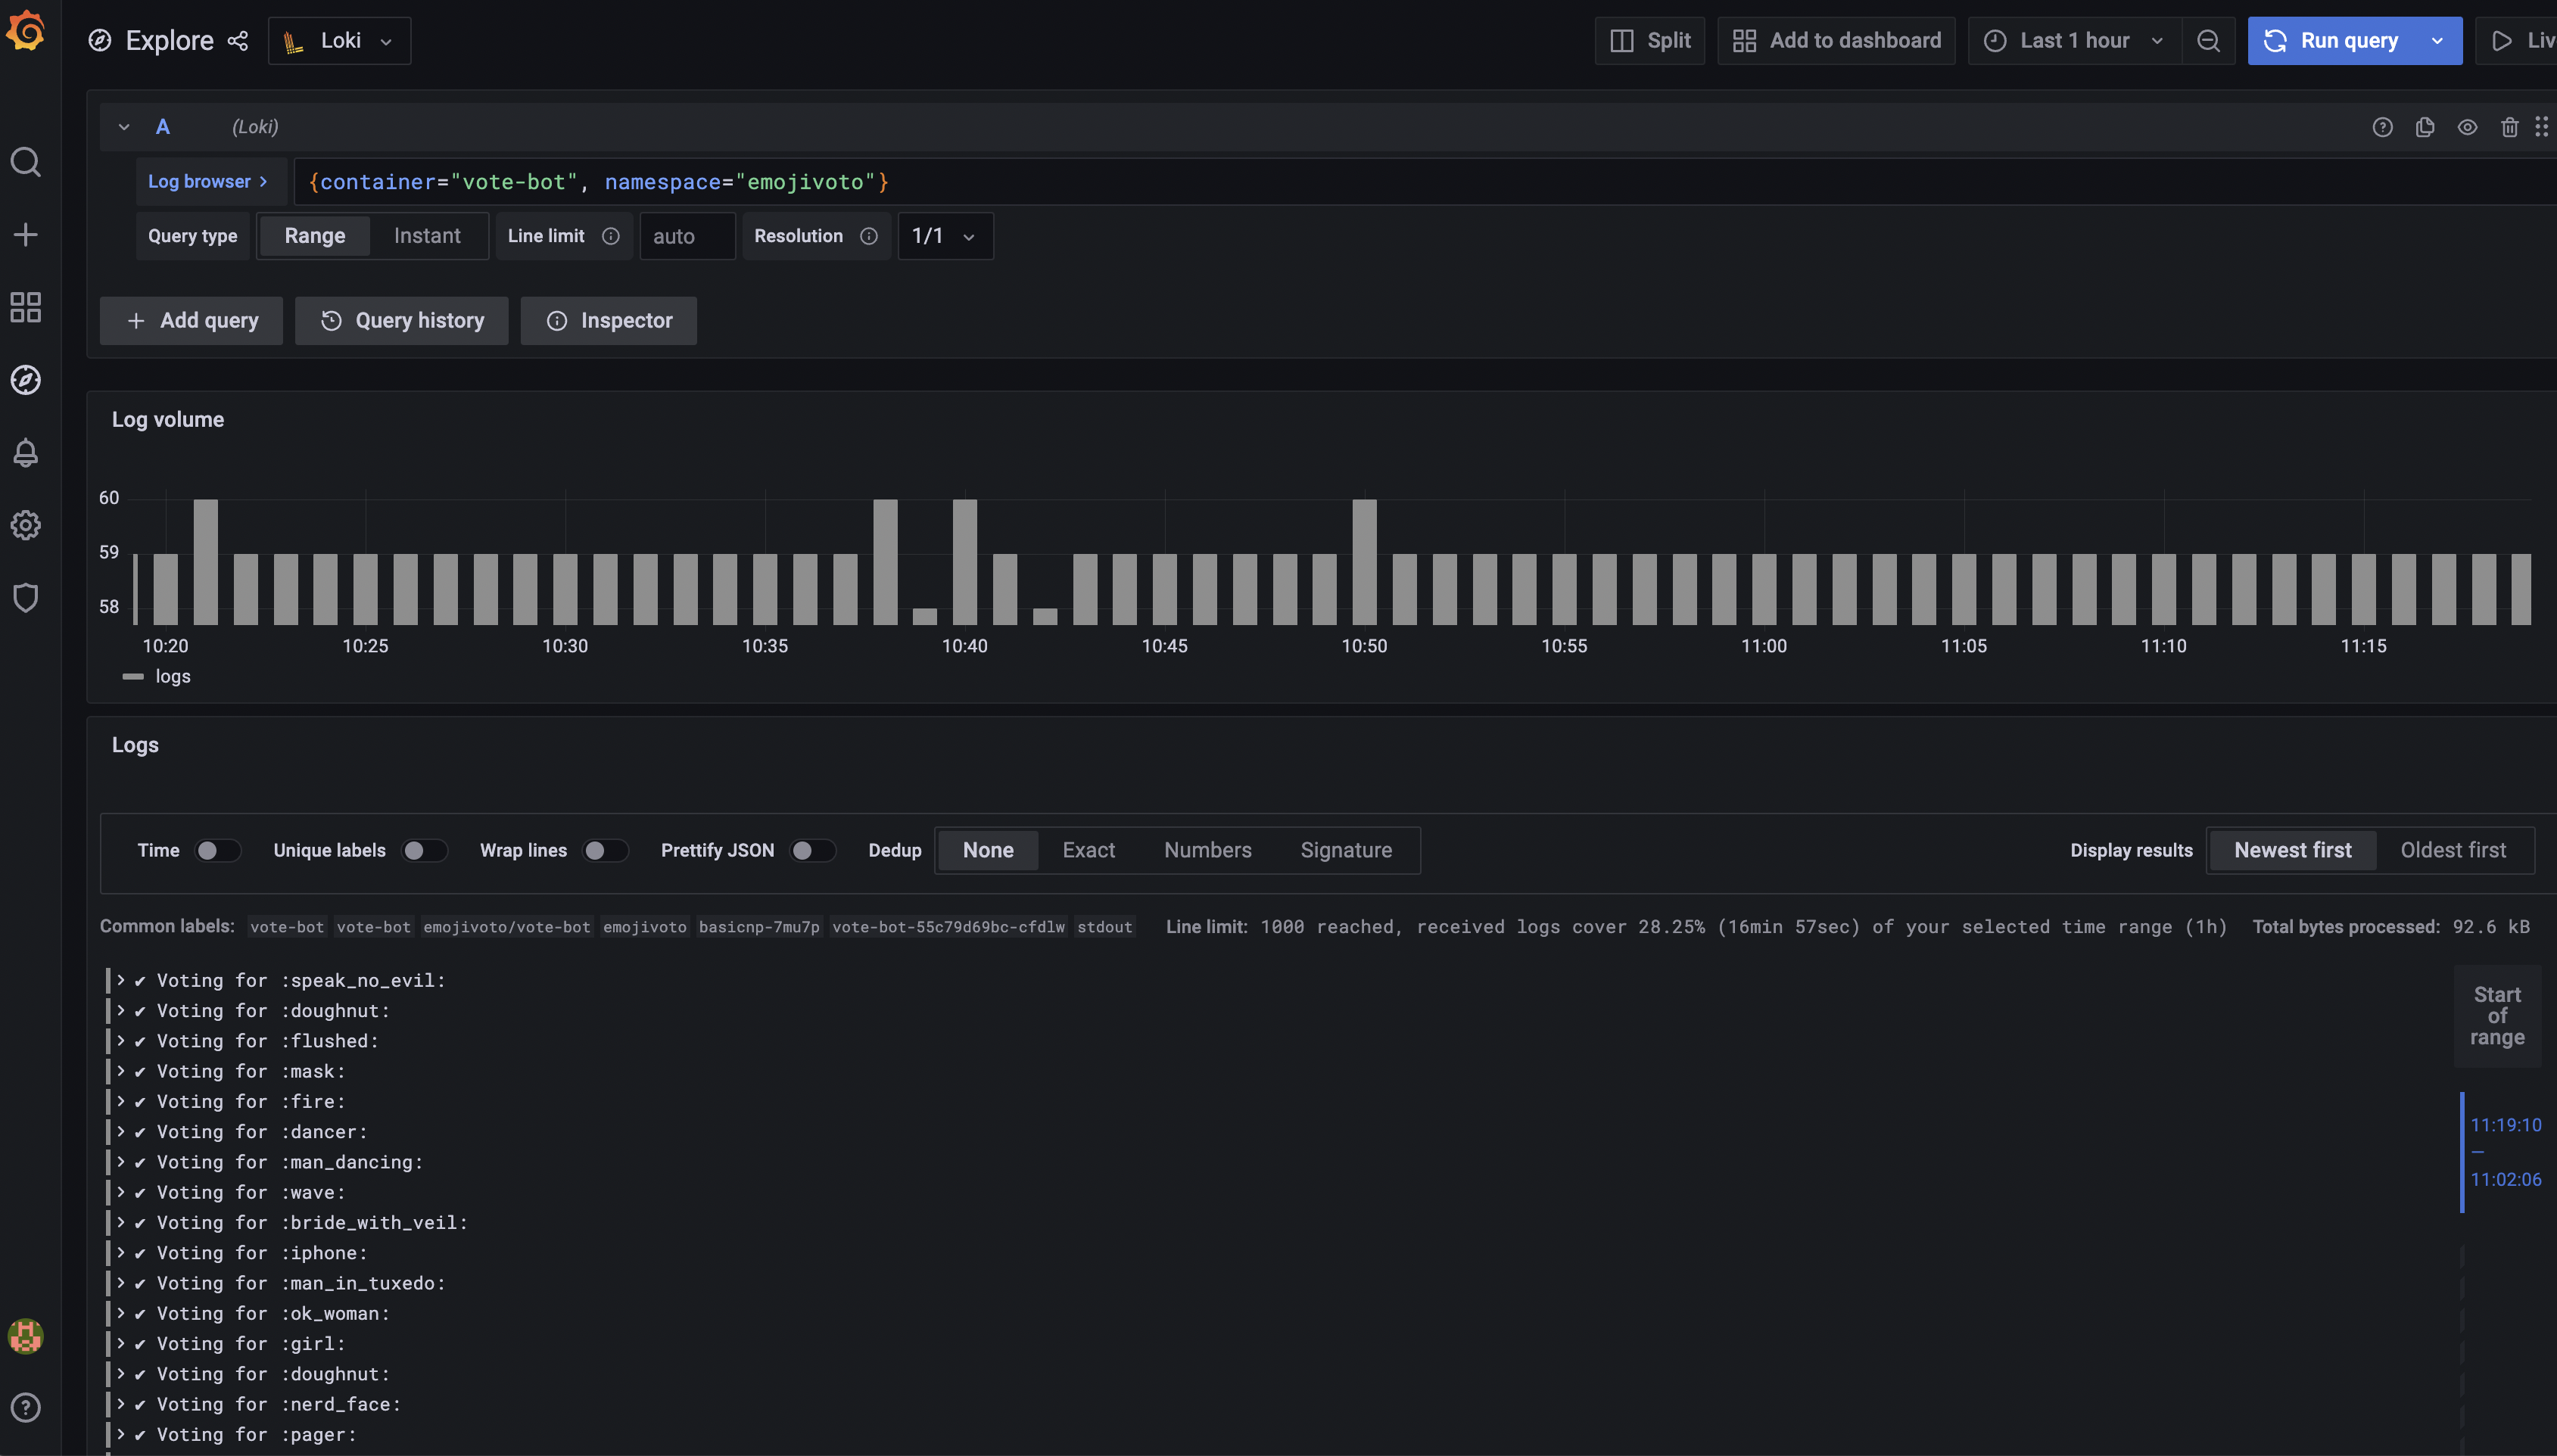
Select Loki from the data source menu, and run this query:
{container="vote-bot", namespace="emojivoto"}
The output looks similar to the following:
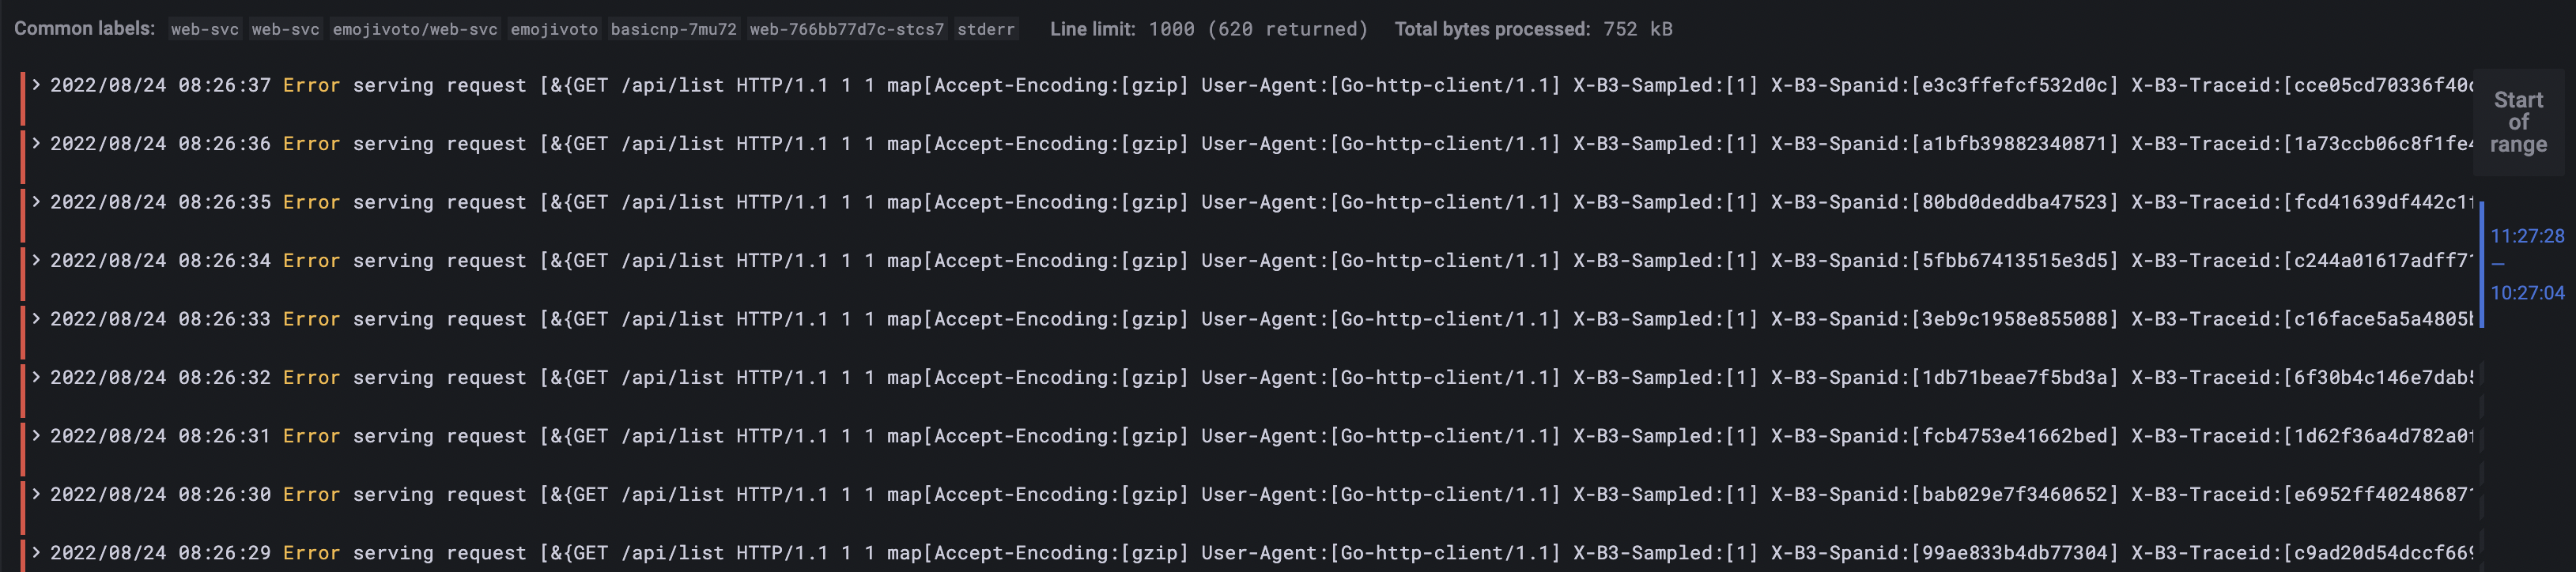
 Perform another query, but this time filter the results to include only the
 Error message:
{container="web-svc",namespace="emojivoto"} |= "Error"
The output looks similar to this (notice how the Error word is being highlighted in the query results panel):
Setting Loki Storage Retention
In this step, we will set the retention policies for DO Spaces.
- Since we configured
DO Spacesas the default storage backend forLoki,the same rules apply for everyS3compatible storage type. Retentionis an essential aspect when configuring storage backends becausestorage is finite.WhileSpacesstorage is not expensive, having a retention policy set is a good practice.S3compatible storage has its own set of policies and rules for retention. In theS3terminology, it is calledobject lifecycle.On the official documentation page, you can learn more about the DO Spaces bucket lifecycle options.
Next, we will use the loki-do-spaces-lifecycle.xml configuration file to set up the retention for the Loki bucket.
<!--
loki-do-spaces-lifecycle.xml

The `lifecycle` configuration will automatically `delete` after `10 days`, all the objects from the `fake/` and `index/` paths in the `Loki` storage bucket.

A `10 days lifespan is chosen in this example because it's usually enough for development purposes.
For `production` or other critical systems, a period of `30 days` and even more is recommended.

-->
<LifecycleConfiguration xmlns="http://s3.amazonaws.com/doc/2006-03-01/">
<Rule>
<ID>Expire old fake data</ID>
<Prefix>fake/</Prefix>
<Status>Enabled</Status>
<Expiration>
<Days>10</Days>
</Expiration>
</Rule>

<Rule>
<ID>Expire old index data</ID>
<Prefix>index/</Prefix>
<Status>Enabled</Status>
<Expiration>
<Days>10</Days>
</Expiration>
</Rule>
</LifecycleConfiguration>
Configure the Spaces lifecycle using s3cmd
-
Open and inspect the
loki-do-spaces-lifecycle.xmlfile using a text editor of your choice -
Then, set the
lifecyclepolicy (please replace the<>placeholders accordingly):s3cmd setlifecycle assets/manifests/loki-do-spaces-lifecycle.xml s3://<LOKI_STORAGE_BUCKET_NAME>
Verify the Spaces lifecycle and usage
-
Finally, check that the
policywas set (please replace the<>placeholders accordingly):s3cmd getlifecycle s3://<LOKI_STORAGE_BUCKET_NAME> -
Inspect the bucket
sizeandnumberof objects via thedusubcommand ofs3cmd.s3cmd du -H s3://<LOKI_DO_SPACES_BUCKET_NAME>The output looks similar to the following (notice that it prints the bucket size -
42M, and the number of objects present -4624):42M 4624 objects s3://loki-storage-test
The DO Spaces backend implementation will automatically clean the objects for you based on the expiration date.
Note: You can always edit the policy if needed by uploading a new one.
Conclusion
By leveraging Grafana Loki and DigitalOcean Spaces, you can effectively aggregate, visualize, and monitor application logs while ensuring proper log retention. This setup provides a scalable and cost-effective solution for log management in DigitalOcean Kubernetes environments.
Remember to adjust the retention policies according to your specific needs, considering factors such as data compliance requirements, storage capacity, and application monitoring purposes.
Happy log aggregation, monitoring, and troubleshooting with Grafana Loki and DigitalOcean Spaces on DigitalOcean Kubernetes!